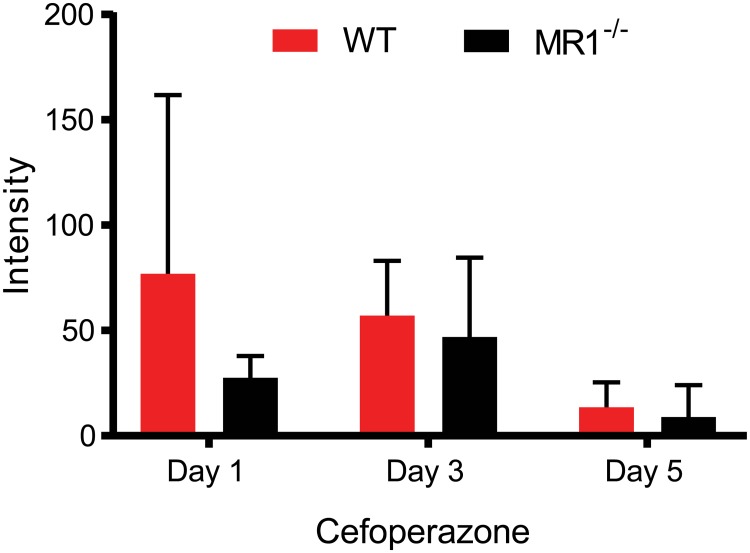
Fig 4. Cefoperazone absorption is the same in WT and MR1-/- mice.
Levels of cefoperazone in intestinal contents were analyzed by UPLC/QTof-MS after one, three and five days of antibiotic treatment. Data shown are normalized based on the total intensity of each run and are mean ±SD. Day 1: p = 0.50, n = 2 mice per groups; Day 3: p = 0.72, n = 3 mice per group; Day 5: p = 0.70, n = 3 mice per group.

