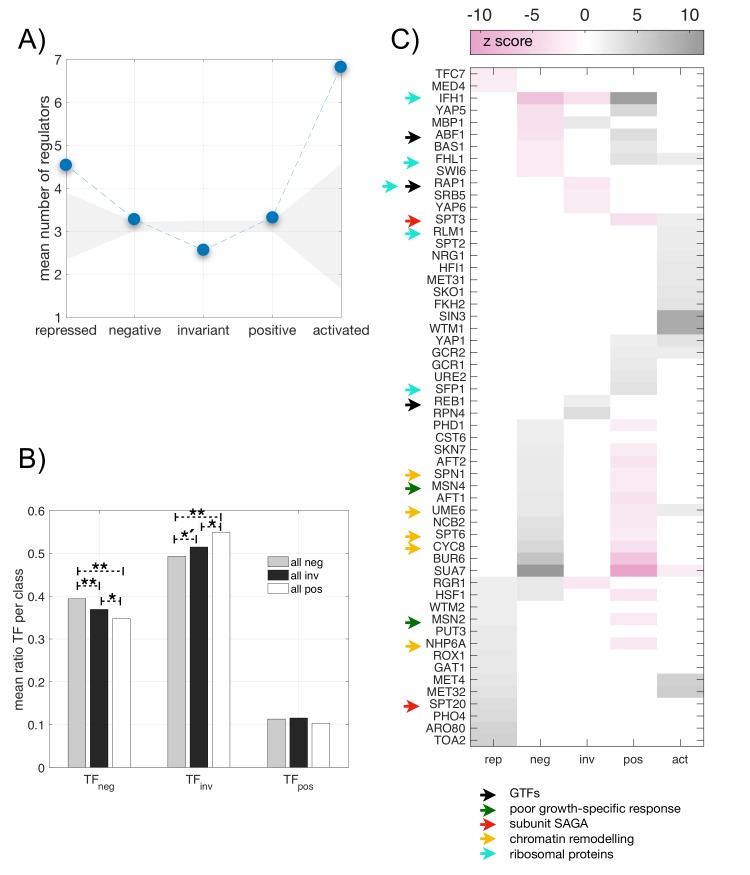
Fig 3. Differential integration of transcriptional regulation and the five-sector resource allocation model.
A) Mean number of regulators acting on genes as a function of their response to growth (blue dots; dashed line to help visualization). Grey shading denotes the average null values +/- 2 standard deviations obtained by randomization. B) Mean ratio of the fraction of TFs of a given class with respect to growth (e.g., TFneg denotes TFs which are negative genes) for each group of target genes (also for a given class; here we do not distinguish between nonspecific and specific). Histogram obtained in glucose conditions, see also S3 Fig for other nutrients (** p < 0.001, *´ p < 0.01, * p < 0.05, two-sided KS test). C) Regulators that act dominantly, or secondarily, in genes showing a significant regulatory coherence. Color denotes z-score with respect to a null obtained by randomization (positive values denoting enrichment; negative values denoting lack of it). Properties of some regulators are also included (arrows). See main text for details.

