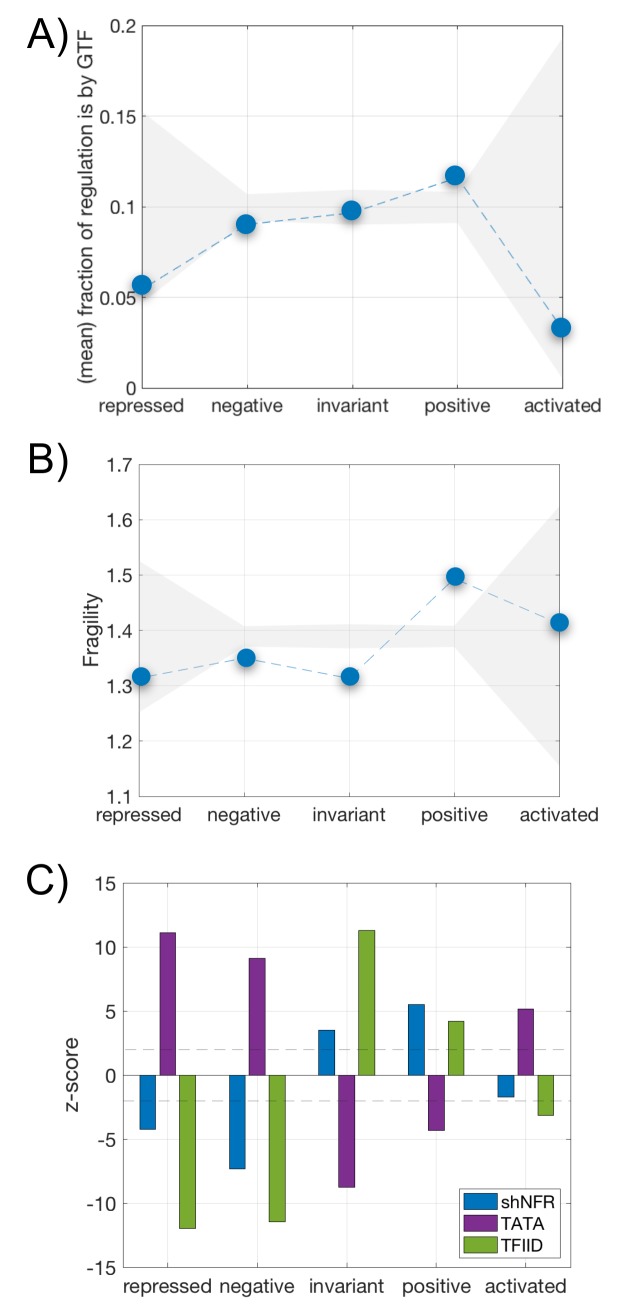
Fig 4. Differential integration of epigenetic regulation and the five-sector resource allocation model.
A) Mean fraction of global transcriptional regulators (Rap1, Abf1, Reb1, Cbf1 and Mcm1) within the full set of regulators acting on each gene. Grey shading denotes the average null values +/- 2 standard deviations obtained by randomization. Dashed lines to help visualization. B) Mean nucleosomal fragility. Shading/lines as before. C) Enrichment of nucleosomal free regions (shNFR, blue), presence of TATA boxes (purple), or action of TFIID global factor (green) as function of response class (measured as z-score with respect to a null by randomization; dashed line indicates z-score = +/- 2).

