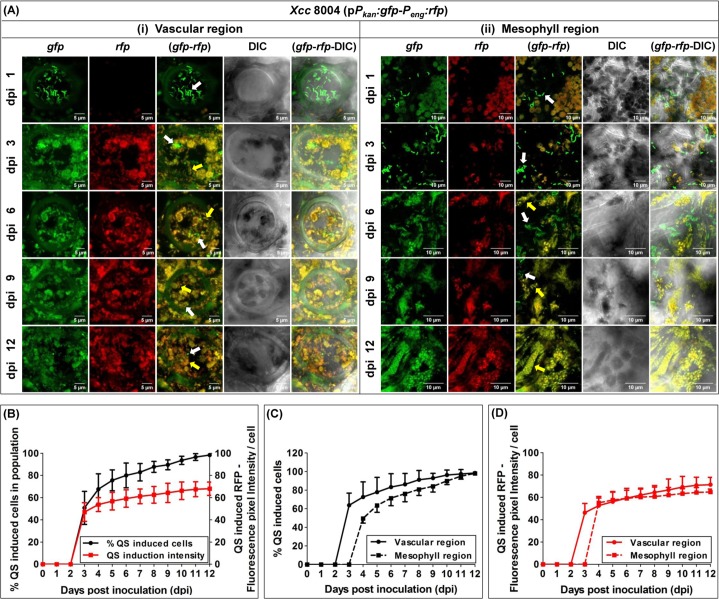
Fig 2. With spatio-temporal distribution, Xcc experiences QS homogeneity during late stage of disease establishment in planta.
(A) Representative CLSM pictures showing the differential spatio-temporal localization and QS distribution dynamics for the wild-type Xcc 8004 dual-bioreporter populations within both xylem vessels and their surrounding mesophyll regions of the infected cabbage leaves upto dpi 12. (i) Transverse sections of individual xylem vessels. Scale bars on each panel, 5 μm. (ii) Mesophyll regions. Scale bars on each panel, 10 μm. The panels from top to bottom represent the individual and merged images of green and red fluorescence and bright field for dpi 1, 3, 6, 9 and 12. The panels for each dpi (left to right) show gfp, rfp, gfp-rfp merged, DIC, gfp-rfp-DIC merged images respectively. Yellow arrows; QS-induced cells, White arrows; QS uninduced cells. Images were prepared using ImageJ-win32 software. (B) Quantifications of total QS-induced bacterial population with QS intensity per bacterial cell within Xcc 8004 bioreporter population in planta. (C) Percentage QS-induced Xcc 8004 bioreporter populations, and (D) QS intensity per Xcc 8004 bioreporter cells within the populations; localized within vascular and mesophyll regions. Bacterial no. and QS-induced fluorescence pixel intensities were calculated using FIJI (image J) and ZEN softwares. Data analysis was done by taking six different confocal images as samples for each strain at a time with the experimental repeat of at least thrice and represented with Mean ± SD.

