Figure 5.
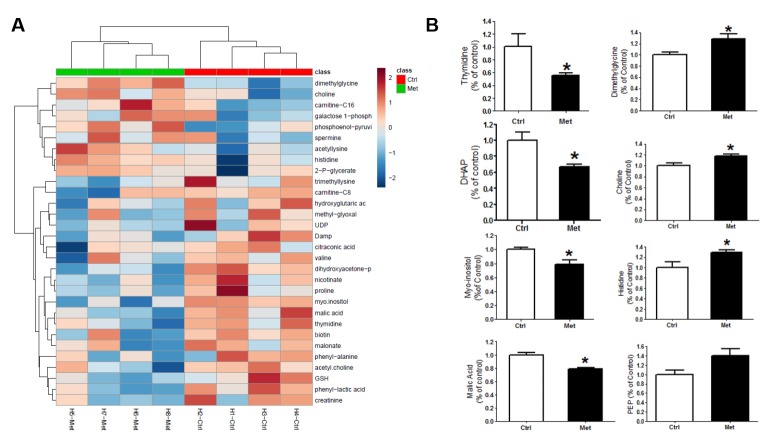
Metformin treatment altered metabolomic profile in hippocampus of young male normoglycemic mice. A) Heatmap of 145 metabolites (Supplementary Table) in mice hippocampus after 7-day treatment with metformin in drinking water (2mg/ml). B) Metformin treatment significantly increased levels of dimethylglycine, histidine, and choline in the hippocampus. Significant decreased levels of malic acid, thymidine, dihydroxyacetone-phosphate (DHAP), and myo-inositol were observed in the hippocampus of metformin-treated mice (* p<0.05) (n=4).

