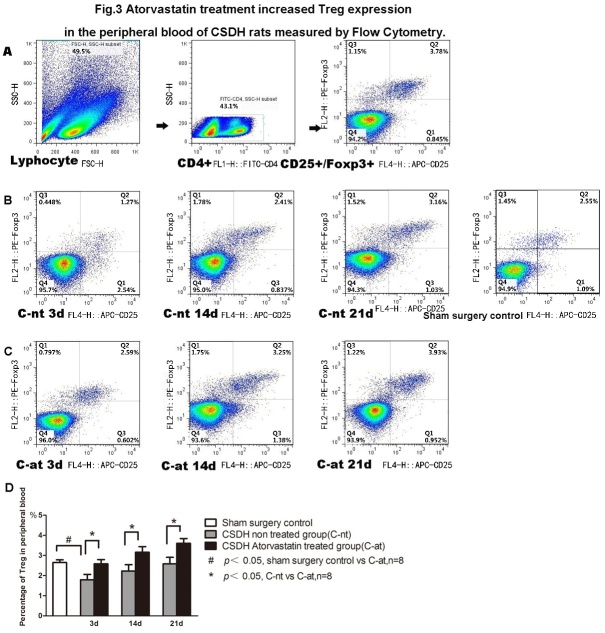
Figure 3.
Atorvastatin treatment increases Treg expression in peripheral blood of CSDH rats as measured by flow cytometry. A) Representative dot plots showing the gating strategy. B) Representative dot plots of Treg cells in the sham control and CSDH-non-treated rats. Panel C) Representative dot plots of Treg cells in Atorvastatin treated rats. Quantitative data for Treg in peripheral blood is presented (D).

