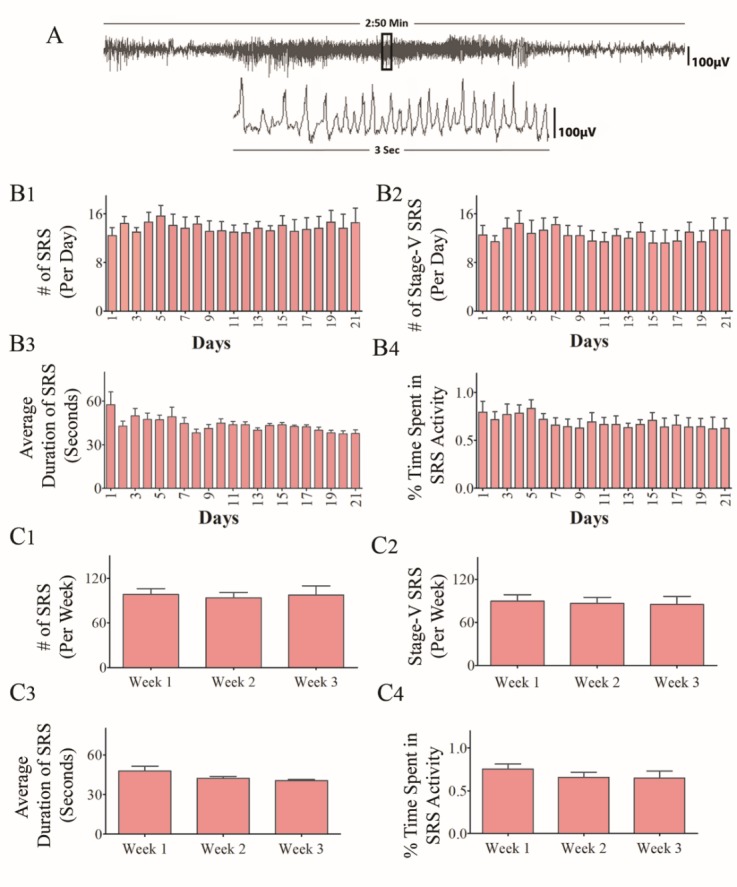
Figure 1.

Analysis of time-locked video-EEG tracings from chronically epileptic rats (CERs) in the 5th month after induction of status epilepticus (SE). Data from 3 weeks of continues EEG recordings are illustrated. (A) An example of EEG tracings during a spontaneous recurrent seizure (SRS). The bar charts in B1-B4 compare daily SRS activity occurring over 21 consecutive days. Note that, the number of SRS per day (B1), the number of stage-V SRS/day (B2), the duration of individual SRS (B3), and the percentage of time spent in SRS activity (B4) were comparable across 21 days (p>0.05, repeated measures ANOVA, RM-ANOVA). The bar charts in C1-C4 compare weekly SRS activity occurring over 3 consecutive weeks. Note that, the number of SRS per week (C1), the number of stage-V SRS/week (C2), the duration of individual SRS (C3), and the percentage of time spent in SRS activity (C4) were comparable across 3 weeks (p>0.05, RM-ANOVA).
