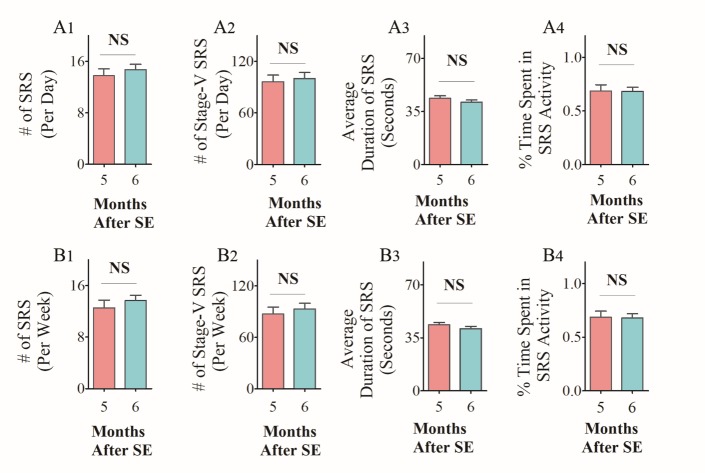
Figure 3.
Comparison of EEG data taken from chronically epileptic rats (CERs) in the 5th and 6th month after status epilepticus (SE). The bar charts in A1-A4 compare the average daily SRS activity occurring over 21 consecutive days. Note that, the number of SRS per day (A1) , the average number of stage-V SRS/day (A2), the duration of individual SRS (A3), and the percentage of time spent in SRS activity (A4) were comparable between CERs recorded in the 5th month after SE and CERs recorded in the 6th month after SE (p>0.05, two-tailed, unpaired Student’s t-test). The bar charts in B1-B4 compare the average weekly SRS activity occurring over 3 weeks. Note that, the number of SRS per week (B1), the number of stage-V SRS per week (B2), the duration of individual SRS (B3), and the percentage of time spent in SRS activity (B4) were comparable across 3 weeks (p>0.05, two-tailed, unpaired Student’s t-test). NS, not significant.

