Figure 6.

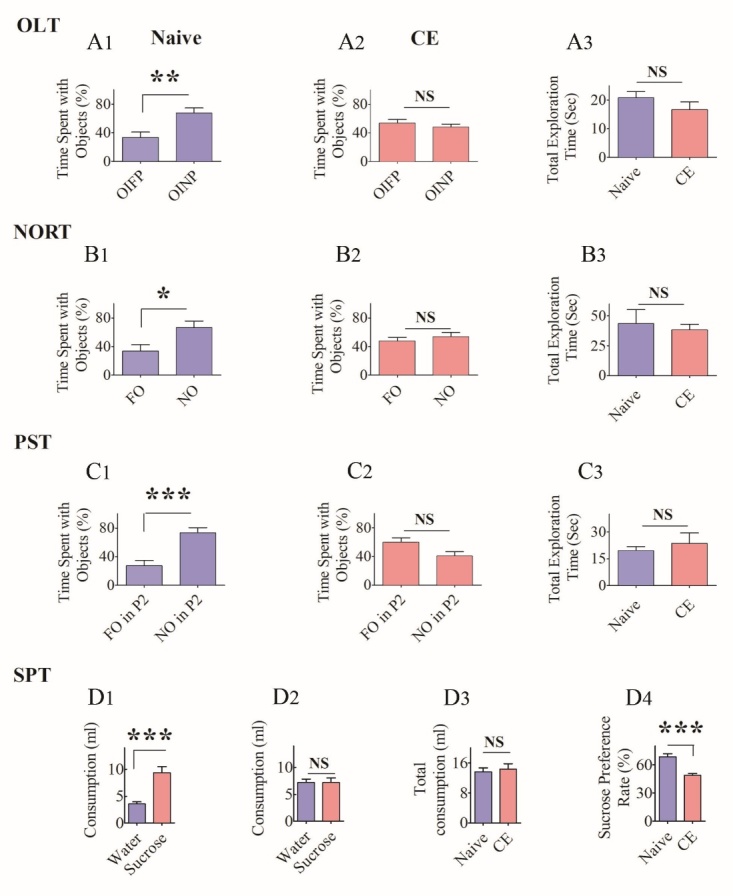
Chronically epileptic rats (CERs) displayed cognitive, memory, and mood impairments. The results of an object location test (OLT, A1-A3), a novel object recognition test (NORT, B1-B3), a pattern separation test (PST, C1-C3), and a sucrose preference test (SPT, D1-D4). The bar charts in A1-A2 compare percentages of time spent with the object in a familiar place (OIFP) and the object in a novel place (OINP) in naïve rats (A1) and CERs (A2) whereas, the bar chart in A3 compares the total object exploration time between naïve rats and CERs. Note that, naïve rats showed a higher propensity to explore OINP over OIFP (p<0.01) whereas, CERs showed no such preference in an OLT (p>0.05). The bar charts in B1-B2 compare percentages of time spent with the familiar object (FO) and the novel object (NO) in naïve rats (B1) and CERs (B2) whereas, the bar chart in B3 compares the total object exploration time between naïve rats and CERs. Note that, naïve rats showed higher propensity to explore NO over FO (p<0.05) whereas, CERs showed no such preference in a NORT (p>0.05). The bar charts in C1-C2 compare percentage of times spent with the familiar object on pattern 2 (FO of P2) and the novel object on pattern 2 (NO on P2) in naïve rats (C1) and CERs (C2) whereas, the bar chart in C3 compares the total object exploration time between naïve rats and CERs. Note that, naïve rats spent a greater amount of time with the NO on P2, in comparison to FO on P2 (p<0.001) whereas, CERs showed no such bias in a PST (p>0.05). The bar charts in D1-D2 compare consumption of regular water and sucrose-containing water in naïve rats (D1) and chronically epileptic rats (CERs). Note that, naïve rats preferred to drink sucrose-containing water (D1) whereas CERs showed no such preference (D2). The bar chart in D3 illustrates that the total consumption of fluid was comparable between naïve rats and CERs. The bar chart in D4 shows that the sucrose preference rate is greater in naïve rats in comparison to CERs (p<0.001). *, p< 0.05; **, p< 0.01; ***, p<0.001; NS, not significant.
