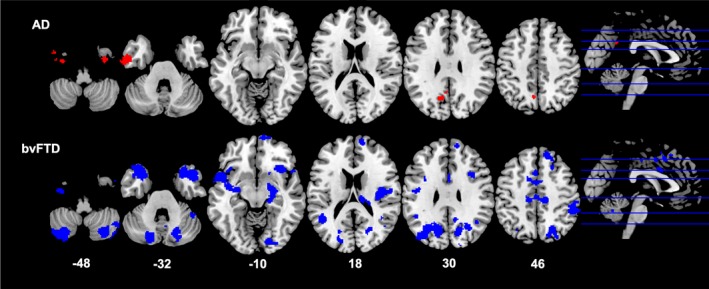
Figure 3.

Neural correlates of VAT Area. Results from voxel‐based morphometry analyses illustrating correlations between an increase in VAT area and decrease in grey matter density in AD (red) and bvFTD (blue) patients. All analyses are reported at P < 0.005 voxel‐wise, uncorrected for multiple comparisons with minimum cluster size of 100 voxels. The left side of the image is the left side of the brain. Numbers below each slice refer to MNI z‐coordinates. AD, Alzheimer’s disease; bvFTD, behavioral‐variant frontotemporal dementia
