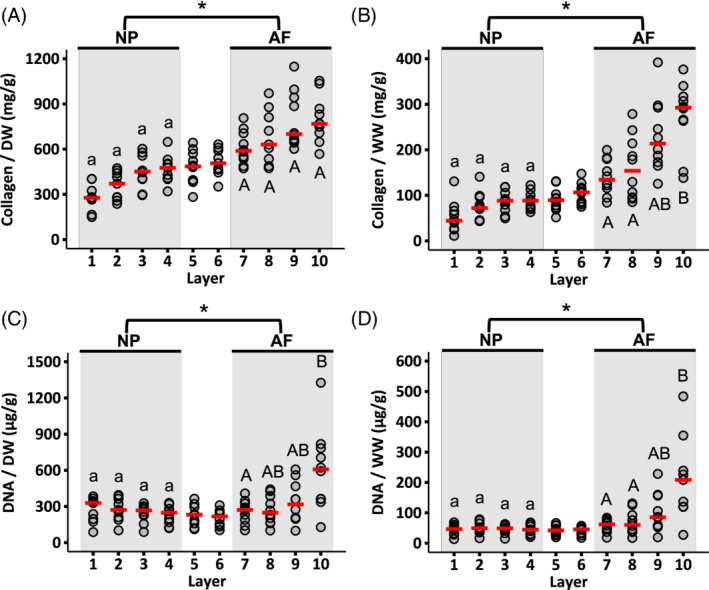
Figure 5.

Radial distribution of collagen content normalized by (A) dry weight and (B) wet weight. Radial distribution of DNA content normalized by (C) dry weight and (D) wet weight. Circles indicate the individual data and red dashes indicate the median values. NP and AF biochemical properties were compared using a Mann‐Whitney U test on pooled data from Layers 1‐4 (NP) and Layers 7‐10 (AF; * represents P < .05). Differences in biochemical composition within each region (ie, shaded areas) were assessed using a Mann‐Whitney U test with Bonferroni correction. Layers that do not share the same letter are significantly different (P < .05)
