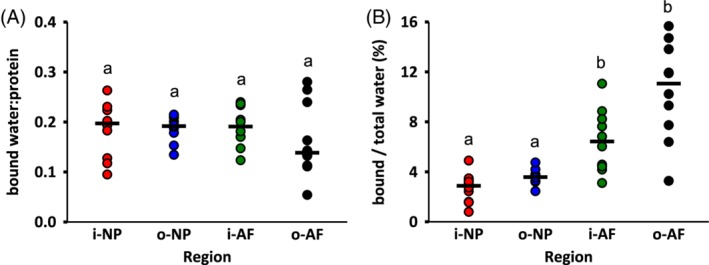
Figure 8.

(A) Bound water content normalized by total protein content, and (B) percentage of bound water content with respect to total water content. Circles indicate the individual data and black dashes indicate the median values. Changes in biochemical composition were determined by performing Kruskal‐Wallis test followed by pairwise comparisons using Mann‐Whitney U test with Bonferroni correction. Layers that do not share a letter are significantly different (P < .05)
