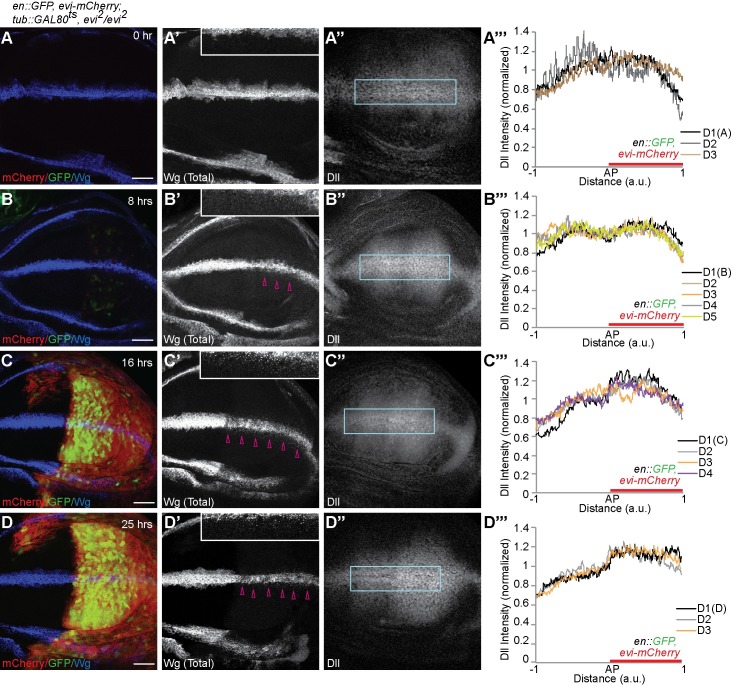
Fig 5. Rescue of Wnt signaling by transient Evi expression.
Genotype of all the discs shown in this figure is en-Gal4, UAS-GFP/UAS-evi-mCherry; tub-Gal80ts, evi2/evi2. (A–A”) Representative images of 0h time point for rescue of evi2/evi2 with Evi-mCherry expression. No expression of GFP or Evi-mCherry can be observed (A). Total Wg staining shows intracellular accumulation of Wg (A’) and Dll expression is unchanged between compartments (A”). Graph (A”’) shows quantification of Dll staining from region marked with blue box in A” (N = 3 discs). (B–B”) Representative images of 8h rescue with very weak expression of Evi-mCherry and GFP (B). Total Wg accumulation is mildly reduced (B’, open arrowheads) and Dll is unchanged (B” and also see B”’ for quantification, N = 5 discs). (C–C”) Representative images of 16h of rescue showing strong expression of Evi-mCherry and GFP (C), reduced Wg accumulation (C’ open arrowheads) and increased Dll expression (C” and C”’ for quantification, N = 4 discs). (D–D”) Total Wg and Dll expression at 25h of rescue (see also D”’ for quantification, N = 3 discs). Insets in A’, B’, C’ and D’ show magnified images of total Wg staining in the posterior compartment. Scale bars 20 μm. AP = Anterior-Posterior boundary, a.u. = arbitrary unit.

