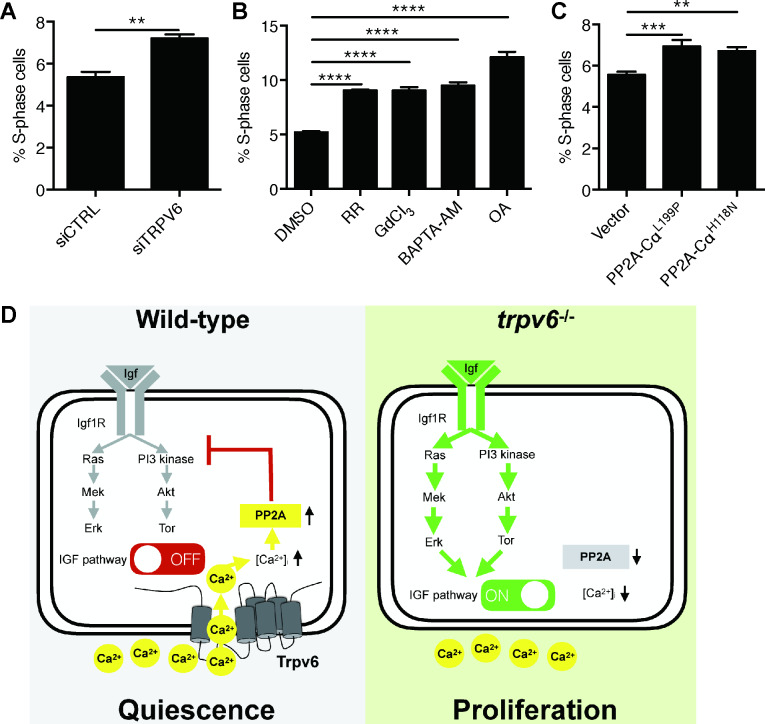
Figure 6. Knockdown and inhibition of TRPV6 and PP2A increases human colon carcinoma cell proliferation.
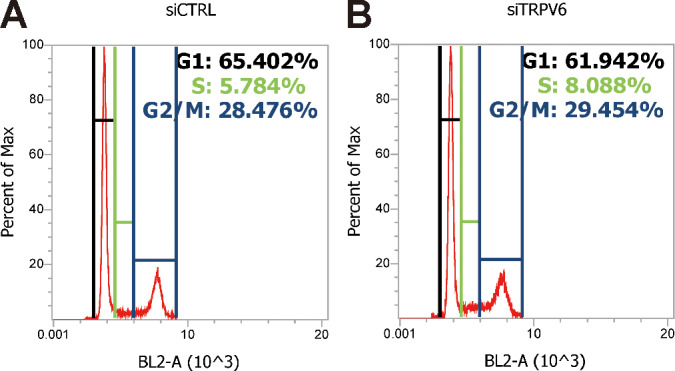
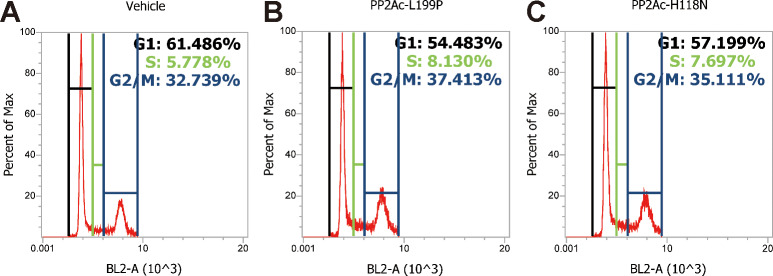
(A) LoVo cells transfected with scrambled siRNA or TRPV6 targeting siRNA were synchronized by serum starvation followed by serum re-stimulation. Cells were analyzed by flow cytometry analysis after propidium iodide staining. Percentage of S-phase cells are calculated and shown. Mean ± SEM, n = 3. **, p<0.01 by unpaired t-test. (B) LoVo cells were synchronized by serum starvation. They were re-stimulated with 2% FBS medium containing Ruthenium Red (RR, 100 µM), GdCl3 (100 µM), BAPTA-AM (100 µM), Okadaic acid (OA, 20 nM) or DMSO for 48 hr and analyzed by flow cytometry analysis after propidium iodide staining. Percentage of S-phase cells are shown. Mean ± SEM, n = 3. (C) LoVo cells transfected with the indicated DN-PP2A constructs were synchronized by serum starvation followed by serum re-stimulation. Cells were analyzed by flow cytometry analysis after propidium iodide staining. Percentage of S-phase cells are calculated and shown. Mean ± SEM, n = 3. ****, ***, ** indicate P<0.0001, P<0.001, P<0.01 by one-way ANOVA followed by Tukey’s multiple comparison test in (B) and (C). (D) Schematic diagram of the proposed model. See text for details.
Figure 6—figure supplement 1. Cell cycle analysis profiles for experiments shown in Figure 6A.

Figure 6—figure supplement 2. Cell cycle analysis profiles for inhibitor experiments shown in Figure 6B.
Figure 6—figure supplement 3. LoVo cell viability.


