. 2019 Sep 23;8:e48056. doi: 10.7554/eLife.48056

Figure 3. Mamo protein expression requires Syp RNA binding protein.

MB lineages (OK107 > GFP) immunostained for GFP and Mamo. A single focal plane near the MB NB is shown. Newborn neurons (NN) are outlined in white and young/maturing neurons are outlined in yellow. Arrows indicate regions with Mamo protein expression. Images are representative of n > 18. Scale bar = 20 μm. The diagram below shows the relative protein levels of Imp (red), Syp (blue), and Chinmo (stars) expressed in the young/maturing neurons when they were newborn 12 hr prior (based on Figure 3—figure supplement 1 and Liu et al., 2015). (A-D) Mamo expression in young/maturing neurons occurs in genotypes with low Chinmo levels (A and C) with the exception of Syp-RNAi plus chinmo-RNAi (D). Note that green dashed circle is labeling other MB neurons. Chinmo immunostaining and quantifications from earlier stages can be found in Figure 3—figure supplement 1. Mamo levels are shown in Figure 3—figure supplement 2.

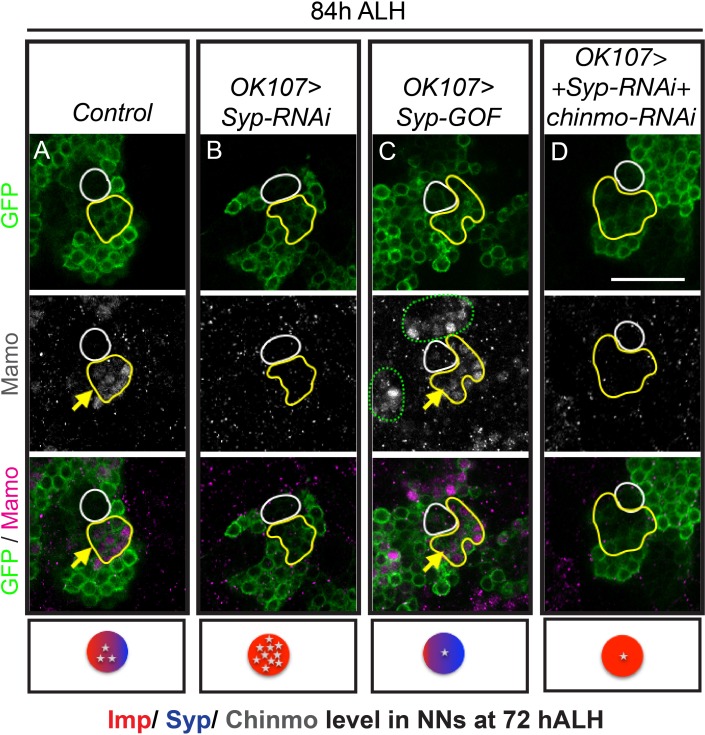
Figure 3—source data 1. Mamo staining intensity in young/maturing neurons with Syp manipulations.
DOI: 10.7554/eLife.48056.012
Figure 3—source data 2. Chinmo staining intensity in newborn neurons with different genetic manipulations.
DOI: 10.7554/eLife.48056.013

Figure 3.

Figure 3—figure supplement 1. Syp gradient alter Chinmo protein expression.

Figure 3—figure supplement 1.

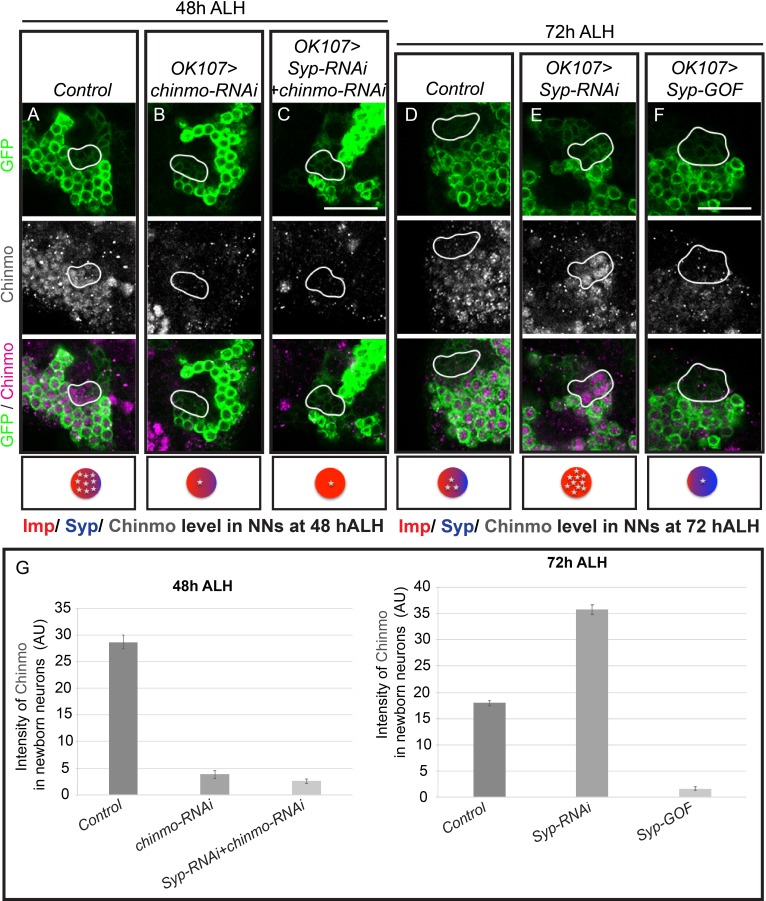
(A–F) Larval MB lineages (OK107 > GFP) immunostained for Chinmo (gray/magenta, Rabbit-anti-Chinmo) and GFP (green). A single focal plane near the MB NB is shown. Newborn neurons are outlined in white. The diagram on the bottom shows the relative protein levels of Imp (red), Syp (blue) and Chinmo (stars) expressed in the young/maturing neurons when they were newborn 12 hr prior. Images are representative of n > 18 Scale bar = 20 μm. (G) The intensity of Chinmo immunostaining (gray line) in different genetic manipulations of MB neurons at different developmental times. The Chinmo levels were measured in the newborn (mean ± SEM, n = 6 brains). AU, arbitrary fluorescent intensity units.
Figure 3—figure supplement 2. Mamo is absent with premature low Chinmo levels before 60 hr ALH.

Figure 3—figure supplement 2.

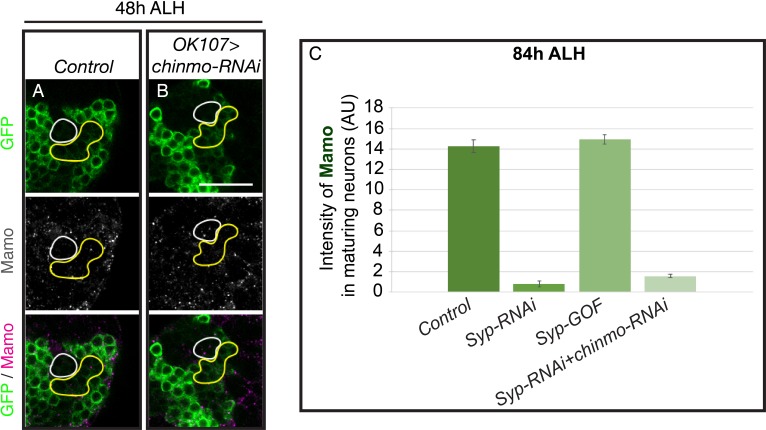
Mushroom body lineages (OK107 >GFP) immunostained for GFP (green) and Mamo (gray/magenta). A single focal plane near the MB NB is shown. Newborn neurons (NN) are outlined in white. Yellow outlines indicate young/maturing neuron region immediately adjacent to the NNs. Images are representative of n > 18. Scale bar = 20 μm. (A-B) At 48 hr ALH, Mamo staining is absent from control (A) and OK107 >chinmo RNAi (B). (C) The intensity of Mamo (Green line) staining in different genetic manipulations of MB neurons at 84 hr ALH. The Mamo levels were measured in the young/maturing neurons (mean ± SEM, n = 5–6 brains). AU, arbitrary fluorescent intensity units.