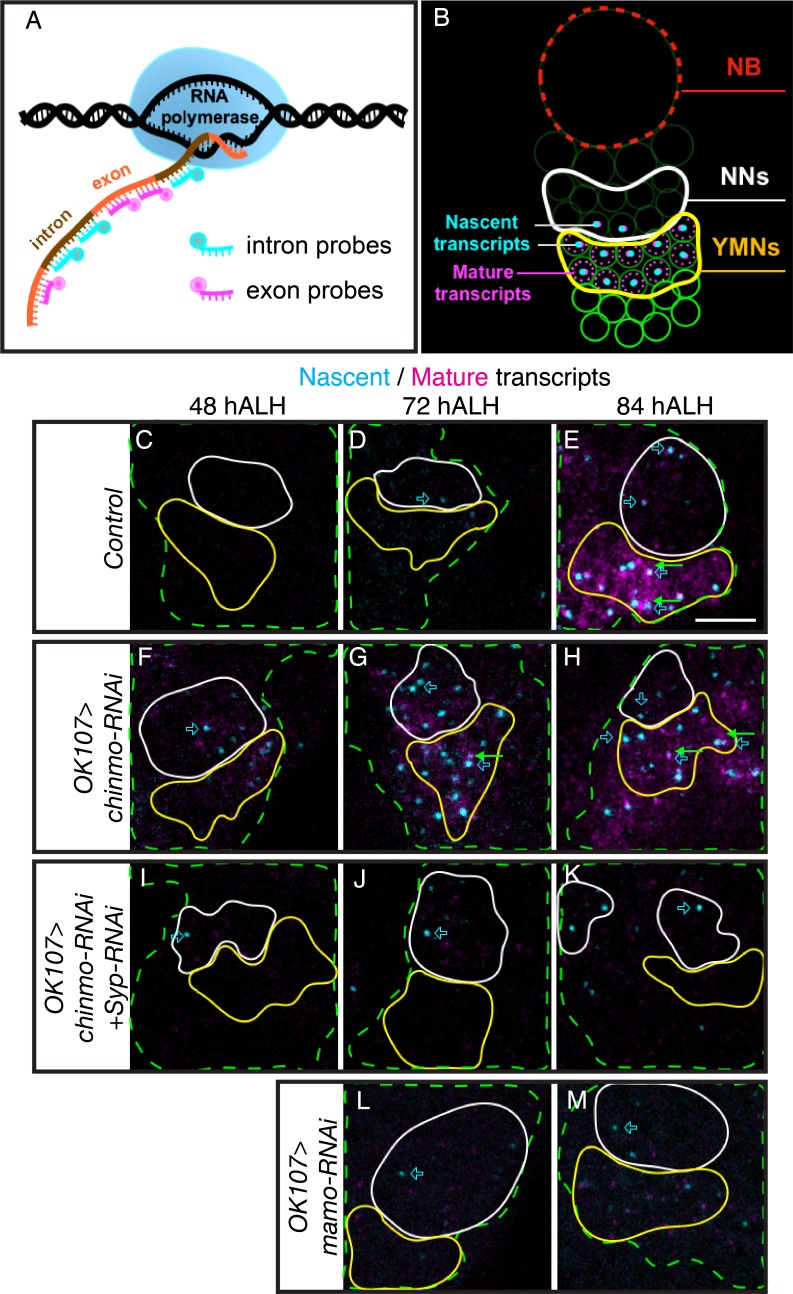
Figure 4. Syp promotes sustained mamo transcription.
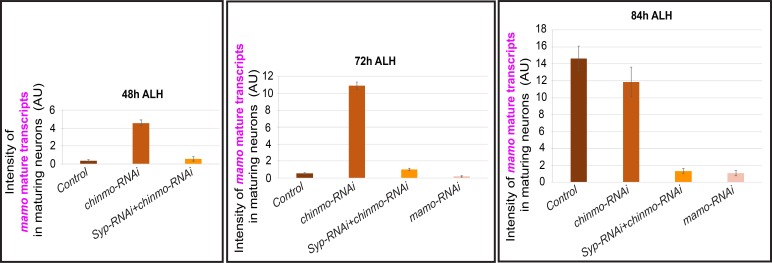
(A) Graphic illustrating the use of intron and exon probes for single molecule florescent in situ hybridization (smFISH). Nascent transcripts are labeled by both intron and exon probes, while mature transcripts are only labeled by exon probes. (B) Diagram illustrating interpretation of smFISH data. Active transcription is seen as a single, double-labeled focus per cell. Mature transcripts (magenta only) are diffuse and cytoplasmic. (C–M) smFISH with probes targeting mamo intronic (cyan) or exonic (magenta) sequences. Images are of developing larval brains with different genetic manipulations of the MB. Maximum Intensity Z-projections (2.3–3.8 μm) near the MB NB are shown. MB cells are determined by OK107 >GFP (green dashed outline) and the newborn neuron (NN) region is outlined in white and the young/maturing neuron (YMN) region is outlined in yellow. Blue open arrows highlight examples of mamo active transcription, green arrows highlight examples of mature mamo transcripts. Images are representative of n > 6. Scale bar = 5 μm. Control brains (OK107 >GFP) show active transcription in NNs at 72 hr (D) and in NNs and young/maturing neurons at 84 hr (E). Mature transcripts are visible in young/maturing neurons at 84 hr ALH (E). OK107 >chinmo-RNAi results in a shift in the timing of mamo transcription. Active transcription is visible at 48 hr in both NNs and young/maturing neurons (F) and is abundant at 72 hr and 84 hr ALH (G and H). Note that MBs expressing chinmo-RNAi together with Syp-RNAi have active transcription in NNs at all time points, but lack mature transcripts and active transcription in young/maturing neurons (I–K). Depleting mamo (OK107 >mamo-RNAi) causes loss of mature transcripts and active transcription in young neurons (L–M). The quantification of mamo mature transcripts is in Figure 4—figure supplement 1.


