. 2019 Sep 2;8:e49132. doi: 10.7554/eLife.49132

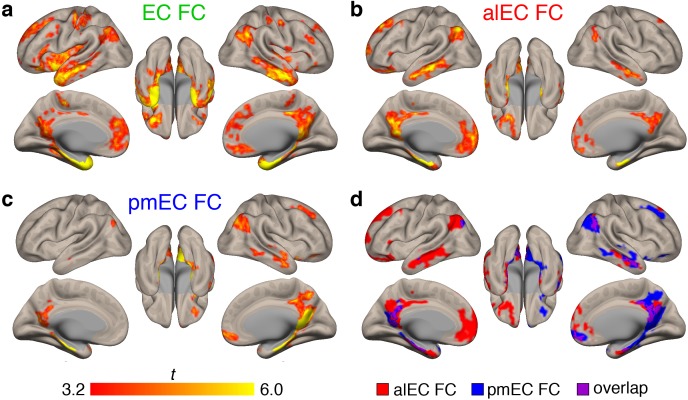
Figure 1. Functional connectivity (FC) of the different entorhinal seeds in healthy young adult (YA) participants.

(a) The full entorhinal seed (EC, green), including transentorhinal, lateral, and medial regions, was derived from FreeSurfer segmentation of each participant’s native space T1, and time series were extracted from native space fMRI data. (b) The anterolateral EC (alEC, red) and posteromedial EC (pmEC, blue) seeds were applied in template space, and time series were extracted before smoothing to preserve the spatial resolution of the seeds. (c–e) Seed-to-voxel FC analyses were performed for each seed with semi-partial correlations. Group level FC results were derived from one-sample t-tests controlling for age and sex, and thresholded at the voxel (p<0.001 uncorrected) and cluster level (p<0.05, FDR corrected). Results reflect t-statistics. (c) FC of the EC seed included medial temporal, lateral temporal, and limbic regions. (d) FC of the alEC seed included anterior temporal regions, such as medial and lateral temporal lobe. (e) FC of the pmEC seed included posterior medial regions, such as the parahippocampal gyrus and posterior cingulate. (f) Binary maps of alEC (red) and pmEC (blue) FC show little spatial overlap (purple) between the FC patterns. See Figure 1—figure supplement 1 for parallel results using OA FC. See Figure 1—figure supplement 2 for a visualization of gray matter voxels removed due to signal drop out, and alEC and pmEC seeds overlaid on the group-mean functional image.

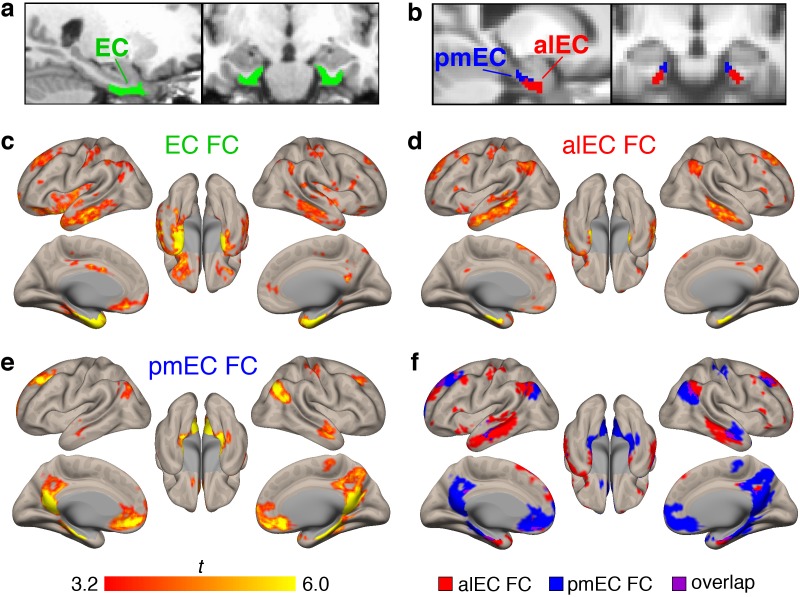
Figure 1.

Figure 1—figure supplement 1. Functional connectivity (FC) of the different entorhinal seeds in older adult (OA) participants.

Figure 1—figure supplement 1.

Seed-to-voxel FC analyses were performed for each seed. Group level FC results were derived from one-sample t-tests controlling for age and sex, and thresholded at the voxel (p<0.001 uncorrected) and cluster (p<0.05 FDR corrected) levels. Results reflect t-statistics. (a) FC of the EC seed included medial temporal, lateral temporal, and limbic regions. The dice similarity coefficient (DSC) between the YA and OA EC maps was 0.45, reflecting moderate overlap. (b) FC of the alEC seed included anterior temporal regions, as well as some posterior medial regions such as the posterior cingulate cortex. DSC between YA and OA alEC maps was 0.36, reflecting fair overlap. (e) FC of the pmEC seed included posterior medial regions, although reduced in scope compared to YA FC patterns. DSC between YA and OA pmEC maps was 0.53, reflecting moderate overlap. (f) Binary maps of the alEC (red) and pmEC (blue) FC show spatial overlap (purple) between the FC patterns, especially in posteromedial cortex.
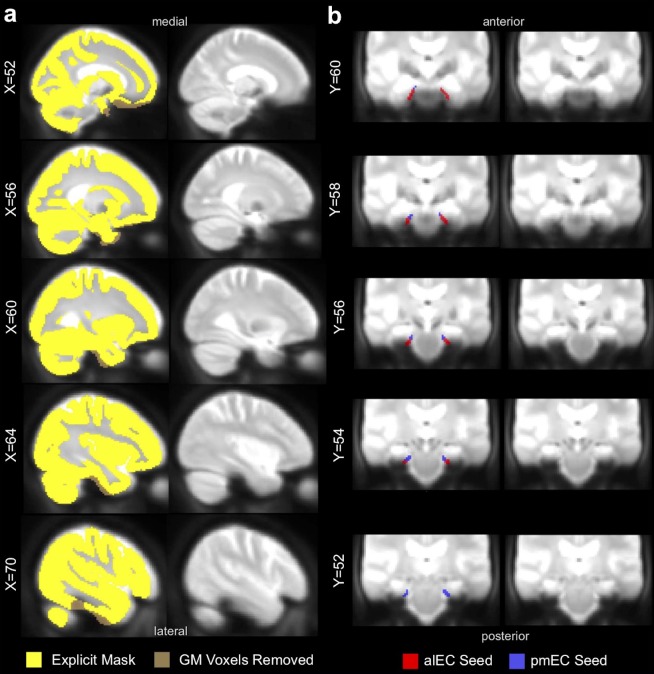
Figure 1—figure supplement 2. Signal drop out demonstrated with group-mean functional images.

Figure 1—figure supplement 2.

(a) A group-level explicit mask (yellow) was created by removing GM voxels of low signal (<40% of the mean signal across the gray matter; shown in brown) from a gray matter mask. This explicit mask was applied to all functional connectivity analyses to ensure regions of low signal did not contribute to results. (b) alEC (red) and pmEC (blue) template space seeds are overlaid on the group-mean functional image to visually demonstrate the average signal in these regions. For functional connectivity analyses, voxels of low signal were removed from each ROI on a participant-level basis.