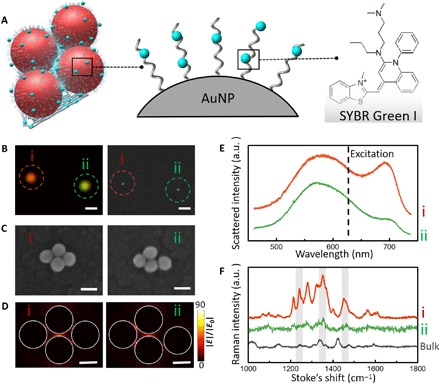
Fig. 4. Characterization and SERS spectra of tetrameric metamolecules.

(A) Schematic of the tetrameric metamolecule that is incorporated with Raman dye. (B) Real-color photograph and the corresponding SEM images of the two individual tetramers (i and ii). Scale bars, 1 μm. (C) High-magnification SEM images reveal the difference between two tetramers. Scale bars, 100 nm. (D) FDTD calculations for two tetramer clusters. Scale bars, 50 nm. (E) Nonpolarized experimentally scattering spectra of the two individual tetramers. (F) Raman spectra of individual tetramers with intercalated SYBR Green I molecules (spectra i and ii) and the highly concentrated bulk solution (black curve) of SYBR Green I. All measurements were performed with a 633-nm excitation laser (10-s exposure).
