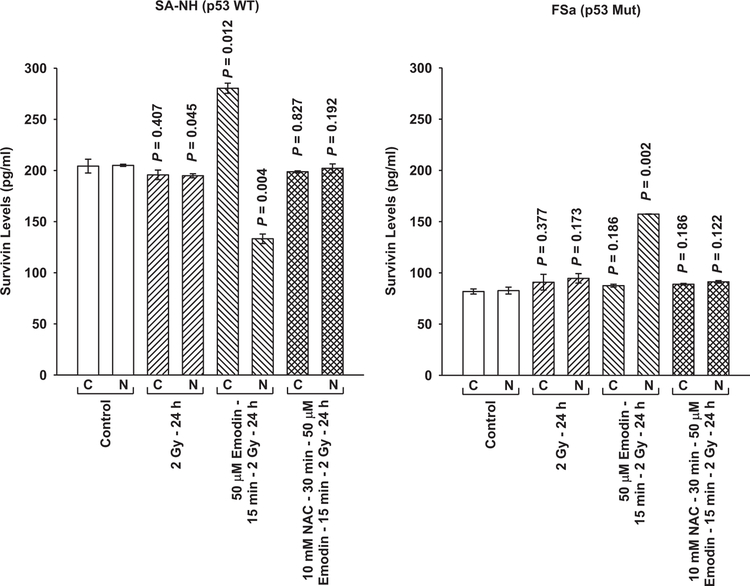
Fig. 4.
Survivin protein in cytoplasmic and nuclear fractions measured by ELISA as a function of Emodin treatment protocol in SA-NH and FSa tumor cell lines. P values were determined by comparing the protein content in the unirradiated control cytoplasmic (C) and nuclear (N) fractions with their corresponding groups from the three treatment protocols: 2 Gy only (SA-NH, P = 0.407 and 0.045, C and N, respectively and FSa, P = 0.377 and 0.173, C and N, respectively; Emodin + 2 Gy ( SA-NH, P = 0.012 and 0.004, C and N, respectively; FSa, P = 0.186 and 0.002, C and N, respectively; and Emodin+ NAC +2 Gy (SA-NH, P = 0.827 and 0.192, C and N, respectively; FSa, P = 0.186 and 0.122, C and N, respectively. Comparisons were performed using a Student’s two-tailed t-test with P values ≤0.05 identi ed as signi cant. Each experiment was repeated three times and error bars represent the SEM.

