
Fig. 1. VO(acac)2 structure and spin phonon coupling distributions.
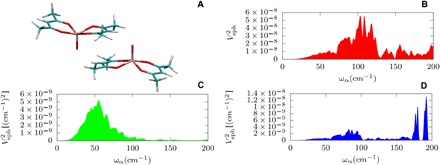
(A) The geometrical structure of the two VO(acac)2 molecular units inside the crystal’s unit cell. Vanadium atoms are represented in pink, oxygen in red, carbon in green, and hydrogen in white. (B) The spin-phonon coupling distribution relative to the Zeeman energy as function of the phonons’ frequency. (C) The spin-phonon coupling distribution relative to the dipolar spin-spin energy as function of the phonons’ frequency. (D) The spin-phonon coupling distribution relative to the hyperfine energy as function of the phonons’ frequency.