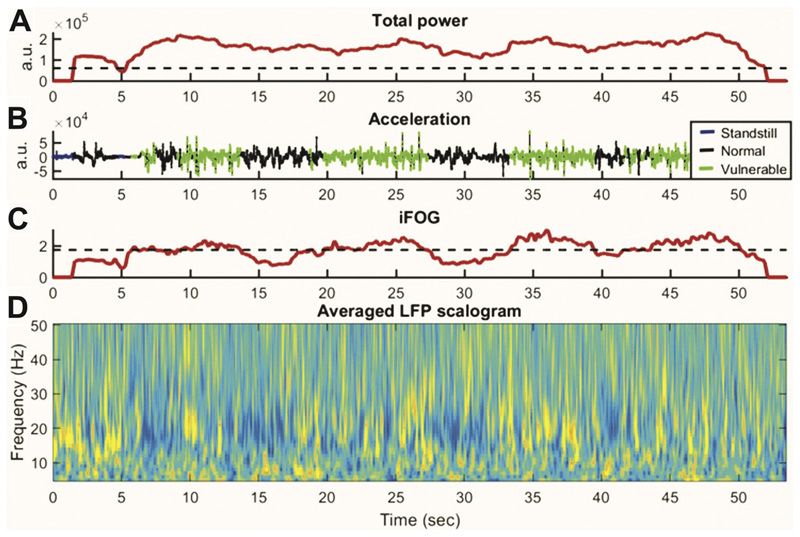
Fig. 3.
Example of simultaneous recordings of ACC recorded by a lumbar accelerometer and STN LFP during gait cycle in patient (case 3). (A) Total power of ACC. Acceleration data were sampled in 3 s windows. (B) Blue indicates standing. Black indicates periods of normal walking. Green indicates the period when gait is vulnerable to freezing, during which the acceleration data show a high-frequency “trembling”. (C) The freezing index, iFOG is calculated from the power in the high frequency band (3–8 Hz) divided by power in the locomotor band (0–3 Hz). The period of vulnerable gait is defined as periods of iFOG exceeding a median threshold. (D) Corresponding averaged LFP across all contact pairs. (For interpretation of the references to color in this figure legend, the reader is referred to the web version of this article.)

