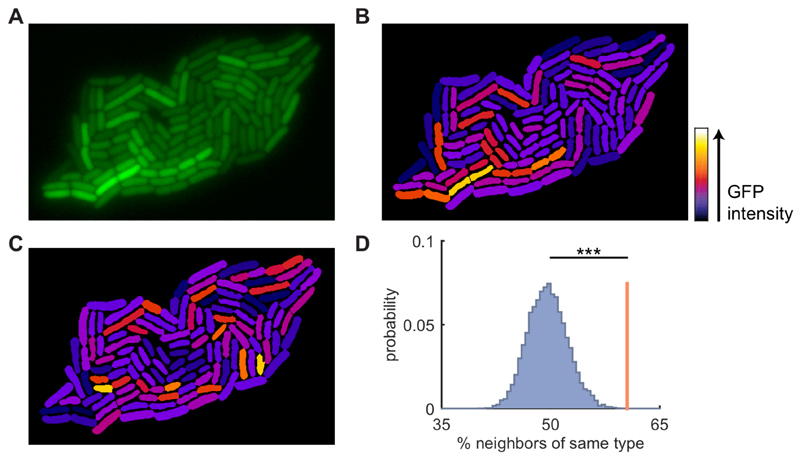
Figure 1. Neighboring cells have similar expression levels of colicin Ib.
A) Fluorescence image of an E. coli microcolony with GFP transcriptional reporter for colicin Ib (cib). B) Reconstructed image of the colony shown in A: cell shapes obtained from cell segmentation are uniformly colored based on their mean corrected intensity (see Figure S1). Note how neighboring cells tend to have similar intensities. C) Same as in B, but fluorescence intensities are randomly permuted among the cells. Note that the similarity between neighboring cells has been reduced compared to B. D) Cells are grouped into two clusters based on their intensity. The red line shows the average fraction of a cell’s neighbors that is of the same type. The blue distribution shows the same quantity obtained after randomly permuting the intensities among the cells (104 permutations). The observed similarity is significantly higher for the true data compared to the randomized data (p<1·10-4, randomization test). See also Figure S1, S2, & S3.

