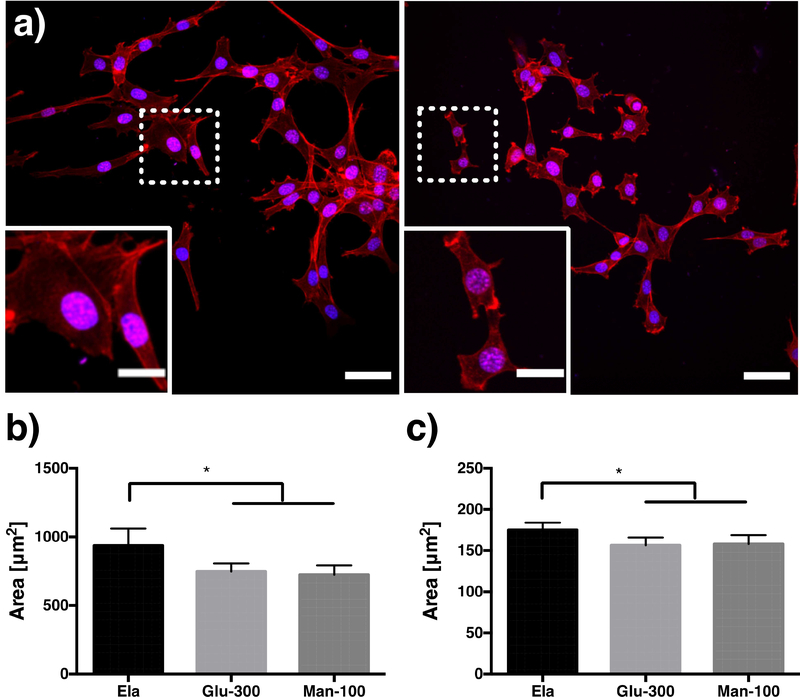
Figure 5:
The effect of viscoelasticity on cellular morphology. (a) Representative images of cells stained for DAPI (blue) and f-actin (red) on elastic gels (left, Ela) and viscoelastic hydrogels (right, Man-Ac). Scale bar = 50 μm. Inset shows higher magnification image of the region in the dotted box, scalebar = 20 μm. The projected cell area (b) and the projected nuclear area (c) of cells cultured on elastic gels (Ela) and viscoelastic gels (Glu-100 and Man-100). Each data point represents the average and 95% CI of n≥9 images containing ≥900 cells total (* p < 0.05).

