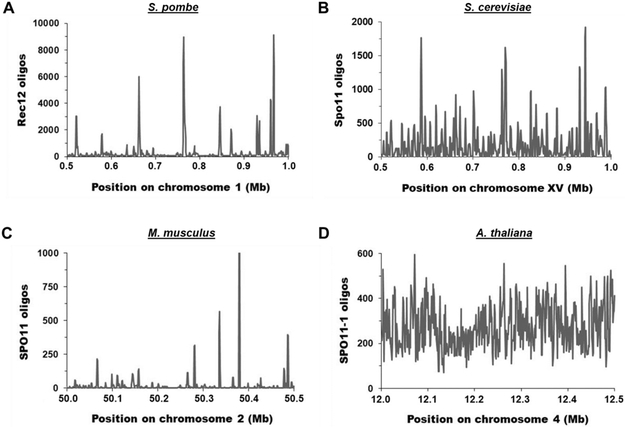
Figure 3. Distribution of Spo11 oligos (DSBs) across representative 0.5 Mb chromosomal arm regions in four species.
The number of Spo11 oligos per 1 kb bin is plotted for each representative genomic region. (A) S. pombe [33]. The mean and median values are 339.9 and 81.5, respectively. (B) S. cerevisiae [32]. The mean and median values are 177.1 and 76.5, respectively. (C) M. musculus [34]. The mean and median values are 19.5 and 2.1, respectively. (D) A. thaliana [35]. The mean and median values are 272.6 and 257.0, respectively.

