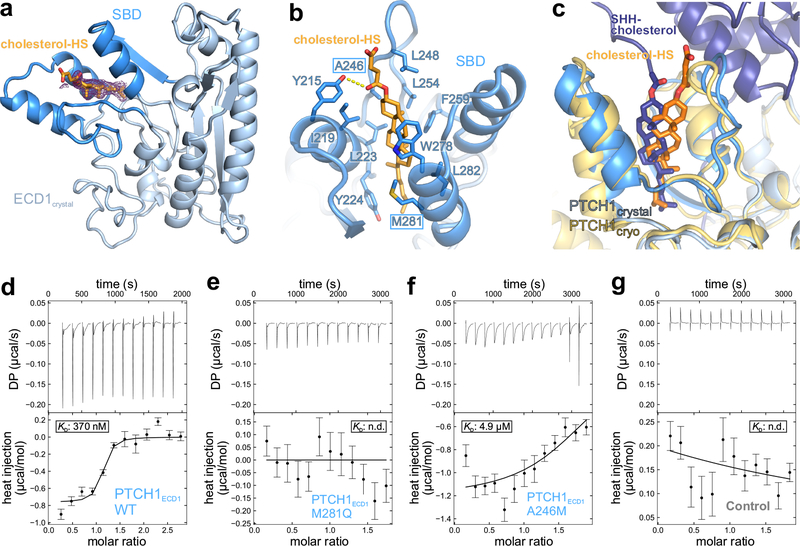
Figure 3 |. Structural and biophysical characterisation of the PTCH1 ECD-cholesterol complex.
a, Crystal structure of the PTCH1ECD1-cholesterol-hemisuccinate (cholesterol-HS) complex, with the 3-helix SBD coloured dark blue. The initial 2Fo-Fc map at 1.0 σ and 1.9 Å resolution before inclusion of cholesterol-HS is shown in wire representation. b, Close-up view of the sterol-binding site with cholesterol-HS depicted in orange sticks. c, Superposition of the PTCH1ECD1-cholesterol-HS crystal structure on the improved PTCH1-pShhNc cryo-EM structure. The entrance of the sterol-binding pocket is slightly rearranged, likely due to different steric constraints of the hemisuccinate group compared to the glycine ester linkage found in pShhNc. d-g, Raw ITC data (upper panel) and binding isotherms (lower panel) for titration of PEG-cholesterol into solutions containing PTCH1ECD1-WT (d), PTCH1ECD1-M281Q (e) and PTCH1ECD1-A246M (f). PEG200, unconjugated to cholesterol, was titrated into a PTCH1ECD1-WT solution as a control (g). Curves show the A+B ⇌AB binding model that was used for local fitting to the data. The Kd is shown where it could be calculated. Bars shown on the isotherm reflect errors associated with integration of the injection peaks in the corresponding thermograms (68% confidence around extrapolation of pre-and post-injection baselines).

