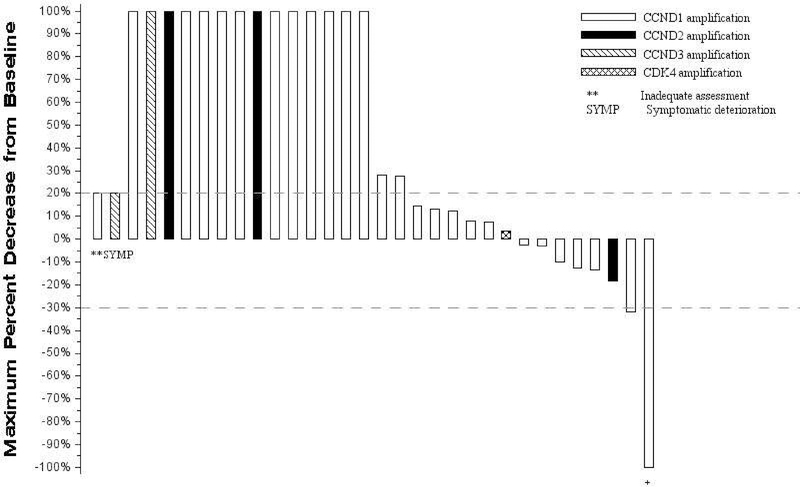
Figure 1.
Waterfall plot of response to palbociclib
Each vertical bar represents a patient’s best percent decrease in tumor burden when compared to baseline as defined by RECIST 1.1. Only patients with measurable disease at baseline are presented in the plot. Patients who did not have follow up tumor disease assessment are presented at the very left of the plot marked with ‘**’. Patients who had new lesions appear at their first follow-up assessment or who expired prior to the first scheduled the disease assessment and the death can reasonably be assumed to be due to disease progression are represented graphically as a 100% increase in tumor burden. Patients who had symptomatic deterioration at first disease assessment are coded as “Symptomatic deterioration”. Negative numbers represent decrease in tumor burden from baseline while positive numbers represent increase in tumor burden from baseline.
+ this patient had complete disappearance of disease and would have been considered a CR, however, the patient’s non-target brain lesion was removed surgically and per RECIST 1.1 guidelines is coded as having a partial response.

