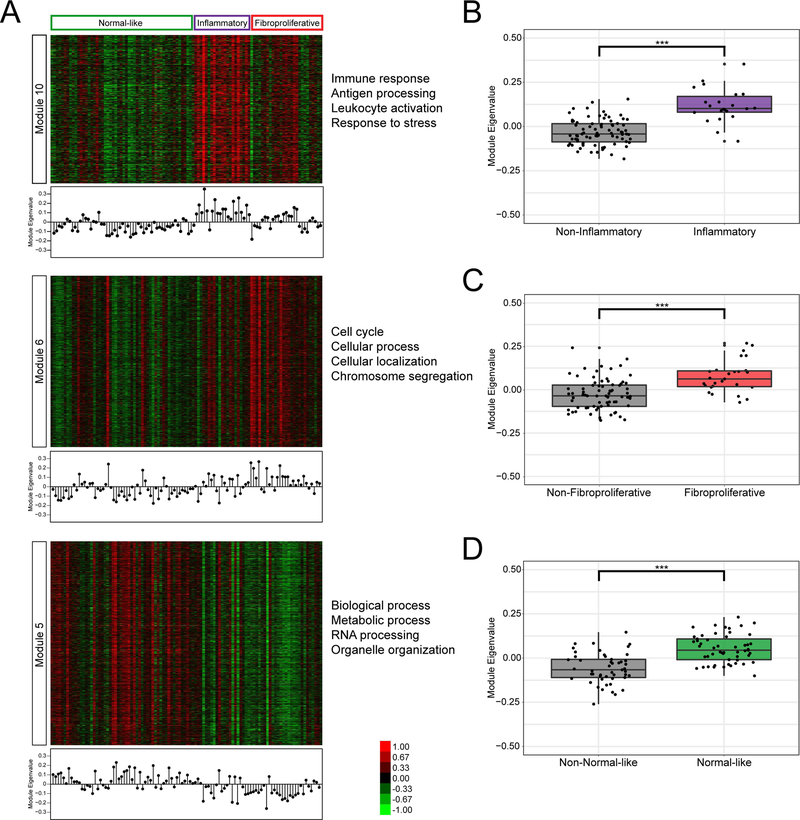
Figure 4: Module analysis of Assassi, et al. (2015).
Expression values are shown for gene annotated to modules 10, 6, and 5 (A). The module eigengene of each module is shown in a stem-plot below each heatmap. The module eigenvalues were further compared for the inflammatory samples vs all others (B), fibroproliferative samples vs all others (C), and normal-like samples vs all others (D) using Wilcoxon Rank Sum Test (***p<0.0005).

