Figure 3.

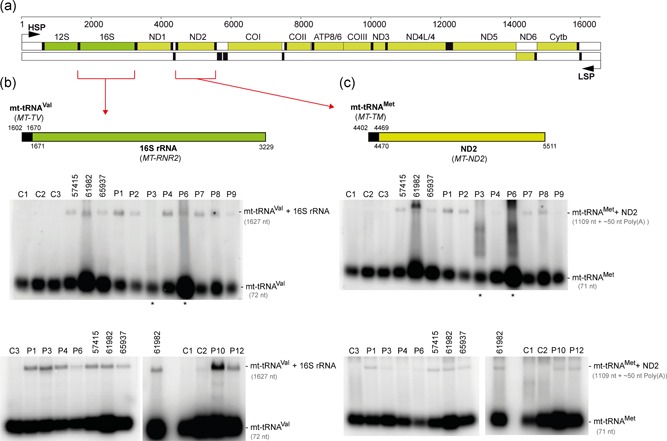
Analysis of unprocessed mitochondrial tRNA–mRNA intermediates. (a) Linear genetic map of mtDNA (numbering according to RefSeq accession number J01415) indicating mt‐rRNA (green), mt‐mRNA (olive) and mt‐tRNA (black). Noncoding sequences in white. The mt‐tRNAVal‐16S rRNA and mt‐tRNAMet‐ND2 mRNA junctions are indicated by red brackets. LSP – Light strand promoter. HSP – Heavy strand promoter. (b) Northern blot processing analysis of the mt‐tRNAVal‐16S rRNA junction in total RNA samples of control fibroblasts (C1‐C3), fibroblasts from the previously published cases (57415, 61982, 65937; Haack et al., 2013) and fibroblasts from the patients harboring novel ELAC2 mutations (P1–4, P6–9, and P12). (c) Northern blot analysis of the processing of the mt‐tRNAMet‐ND2 mRNA junction. Samples as per (b). Asterisks indicate partially degraded RNA samples that were reanalyzed in a different blot and presented in the same panel
