
FIGURE 5.
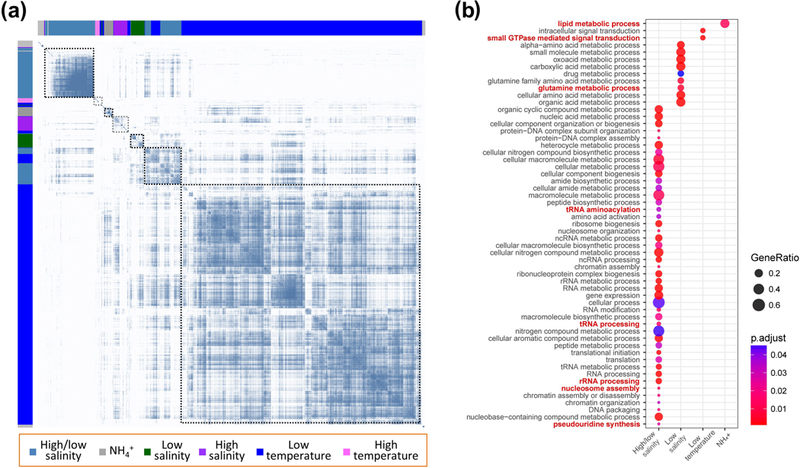
Differential gene expression analysis reveals several large cohorts of co-expressed genes under temperature, salinity and ammonia stresses. (a) Heatmap of weighted gene co-expression network of Euplotes vannus genes (both x-axis and y-axis), in accordance with different stress-response gene groups. Blue dots denote the co-expression relationship between different genes. (b) GO term enrichment analysis on different stress-response gene groups shows many pathways are activated when E. vannus faces environmental stresses (adjusted p-value by Benjamini-Hochberg procedure < 0.05). Dot size denotes the ratio of genes activated in each pathway. Dot color denotes the adjusted p value for activation of each pathway.