
FIGURE 6.
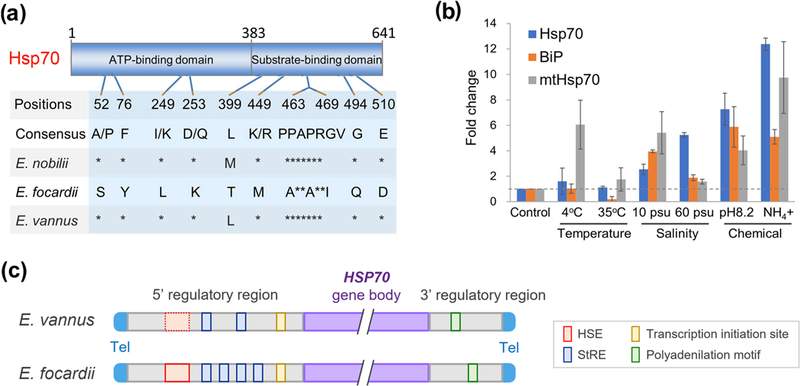
Sequence and gene expression analysis of HSP70 in Euplotes vannus shows changes that may explain its insensitivity to temperature change. (a) Amino acid substitutions that occur in Euplotes focardii at the level of its HSP70 ATP- and substrate-binding domains and are unique with respect to Euplotes nobilii and other organisms. Asterisks denote identities. Numbers indicate essential amino acid positions of Hsp70. (b) Fold change of gene expression level of E. vannus Hsp70 (gene id: MSTRG.11315) as well as its two relatively distant homologs, BiP (Binding immunoglobulin protein, gene id: MSTRG.32307) and mtHsp70 (mitochondrial Hsp70, gene id: MSTRG.32363), under different environmental stresses (4 °C, 35 °C, 10 psu, 60 psu, pH 8.2 or with the presence of free ammonia) with respect to the control (20 °C, 30 psu and pH 7.8). The dashed line in grey denotes the normal level of HSP70 and the other two homologous genes. (c) A schema illustrates the sequence alignment of 5’ and 3’ regulatory regions of Hsp70 genes in Euplotes vannus and E. focardii. Sequence motifs bearing agreement with HSE and StRE elements, putative sites for the transcription initiation and polyadenylation motifs are denoted by red, blue, yellow and green boxes, respectively; neither of E. vannus and E. focardii carries ARE elements in the 3’ regulatory region. The dashed red box shows the poorly conserved HSE element in E. vannus. “Tel” denotes telomere and “gene body” denotes the gene transcription region. The sequence alignment of 5’ and 3’ regulatory regions see Figure S9.