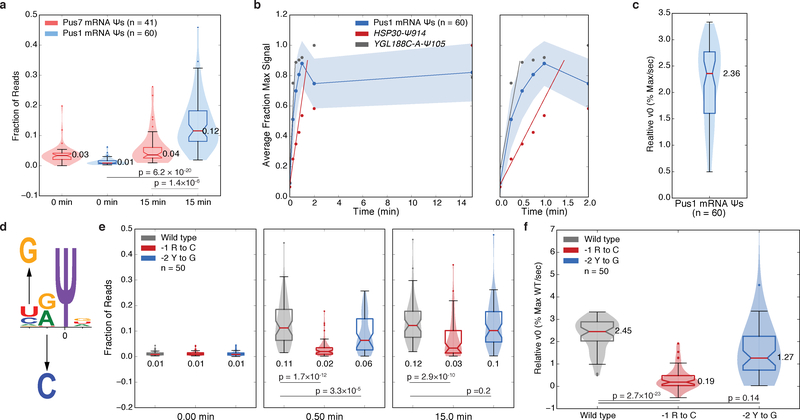
Figure 4: Kinetic Analysis Reveals Sequence Features Important for mRNA Pseudouridylation by Pus1.
a) Violin plots (center lines, medians; notches, 95% confidence intervals; boxes, 25th to 75th percentiles; whiskers, 1.5X inter-quartile range; dots, values outside of the 1.5X IQR) of the distributions of the fraction of reads mapping to the expected RT stop positions for Pus7 mRNA targets (pink, n=41 sequences) and Pus1 mRNA targets (blue, n=61 sequences). Medians, and p-values (unpaired t-test, two-tailed) are indicated. b) The average fraction of maximum signal for n=60 high confidence Pus1 mRNA targets is shown ± standard deviation (blue), for HSP30-Ψ914 (red), YGL188C-A-Ψ105 (gray) on a 0–15 min timescale (left) or a 0–2 min timescale (right). Lines indicating the slope (v0,rel) of the fit are indicated. c) A violin plot (elements as above) of the v0,rel values for n=60 high confidence Pus1 mRNA targets. Median indicated. d) A schematic of sequence motif mutations. e-f) Violin plots (elements as above) of the kinetics of pseudouridylation as indicated by (e) the fraction of reads at expected RT stop positions at indicated timepoints, or (f) v0,rel values for wild type (gray, n=50 sequences), −1 R to C mutants (red, n=50 sequences), and −2 H to G mutants (blue, n=50 sequences). Medians, and p-values (paired t-test, two-tailed) are indicated.

