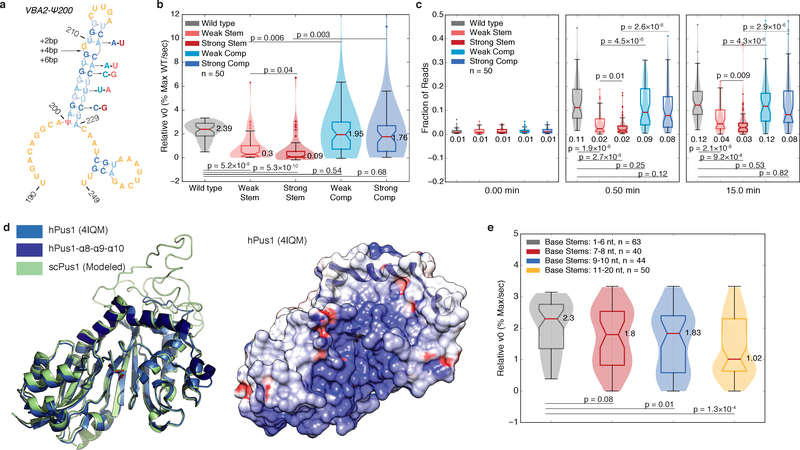
Figure 5: The Rate of mRNA Pseudouridylation Depends on Stem Length and Stability.
a) A schematic of stem disrupting and compensatory mutations for VBA2-Ψ200. See b-c) for description of color scheme. b-c) Violin plots (center lines, medians; notches, 95% confidence intervals; boxes, 25th to 75th percentiles; whiskers, 1.5X inter-quartile range; dots, values outside of the 1.5X IQR) of (b) v0,rel values, or (c) the fraction of reads at the expected RT stop positions at indicated timepoints for wild type (gray, n=50 sequences), weak stem disrupting mutations (pink, n=50 sequences), strong stem disrupting mutations (red, n=50 sequences), weak compensatory mutations (light blue, n=50 sequences) and strong compensatory mutations (dark blue, n=50 sequences). Medians, and p-values (paired t-test, two-tailed) are indicated. d) The structure of hPus1 (light blue, 4IQM, Czudnochowski et al. 2013) with the three-helical RNA binding channel cap (dark blue) with modelled yeast Pus1 (left). An electrostatic surface map of hPus1, with the helical cap in ribbon form (right). e) Violin plots (elements as in above) of v0,rel for wild type, and stem extension mutants binned by base stem length. 1–6 nt (gray, n=63 targets), 7–8 nt (red, n=40 targets), 9–10 nt (blue, n=44 targets), and 11–20 nt (yellow, n=50 targets) bins are shown. Medians, and p-values (unpaired t-test, two-tailed) are indicated.

