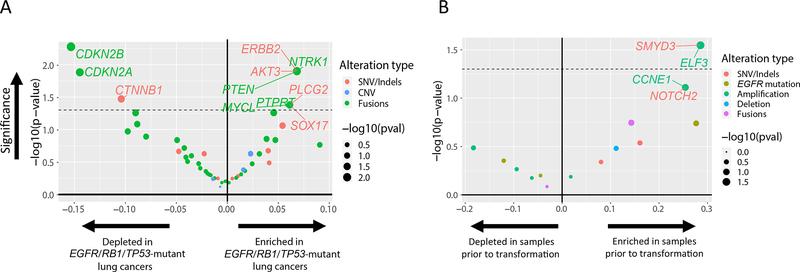
Figure 3.
Enrichment analysis of genomic alterations. (A) Enrichment of mutations in EGFR-mutant lung cancer with concurrent TP53/RB1 mutations versus without concurrent TP53/RB1 mutations. (B) Within EGFR/RB1/TP53-mutant lung cancer, enrichment of mutations in cases with eventual SCLC transformation. Level of enrichment is represented as a volcano plot with the log ratio in frequency between the two states (x-axis) and its significance -log(p-value) (y-axis). The type of alteration is represented by color. The dashed line represents p-value = 0.05.

