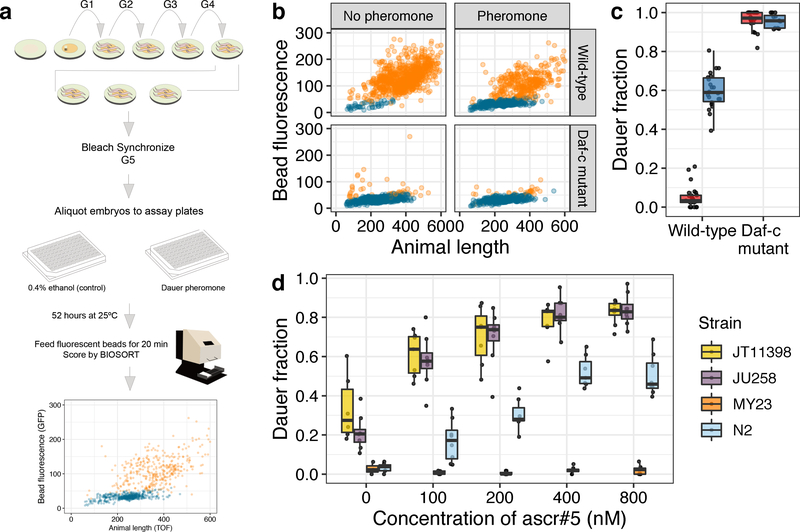
Fig. 1: A high-throughput dauer assay measures natural variation of dauer-pheromone response.
(a) The workflow for the high-throughput dauer assay (HTDA) using a COPAS BIOSORT is shown (see Materials and methods for further description). (b) Optical measurements of the laboratory wild-type strain (N2) (Top) and a Daf-c mutant daf-2(e1370) (bottom) are shown under control (left) and pheromone-treated (ascr#5 800 nM) conditions (right) at 25°C using the HTDA. Animal size and fluorescence-intensity traits are used as variables to build a model that differentiates dauer (blue) and non-dauer populations (orange). Relative animal length measured by time-of-flight (TOF) is shown on the x-axis, and bead-derived fluorescent intensity is shown on the y-axis. (c) Tukey box plots of the dauer fraction quantification from (b) are shown with data points plotted behind. Box plots are colored by assay conditions (control (red) and ascr#5 800 nM treatment (blue)). The genotypes are shown on the x-axis, and fractions of dauer larvae are shown on the y-axis. (d) Tukey box plots of the ascr#5 dose response at 25°C for four divergent strains are shown with data points plotted behind. Concentrations of ascr#5 are shown on the x-axis, and fractions of dauer larvae are shown on the y-axis. (c, d) The horizontal line in the middle of the box is the median, and the box denotes the 25th to 75th quantiles of the data. The vertical line represents the 1.5 interquartile range.

