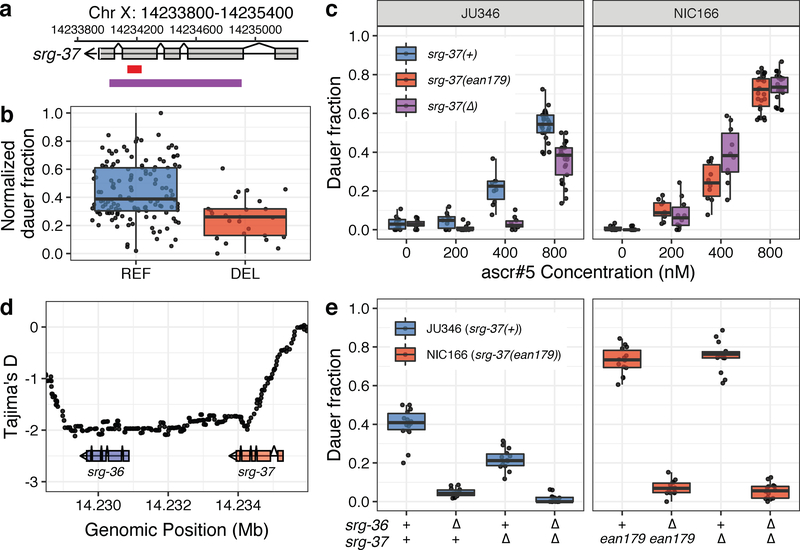
Fig. 3: Natural variant in the ascr#5 receptor gene, srg-37, underlies natural differences in dauer formation.
(a) A schematic plot for the srg-37 gene structure (grey), 94-bp natural deletion allele ean179 (red), and CRISPR-Cas9 genome-editing target sequences for the putative loss-of-function deletion (purple) are shown. (b) Tukey box plots of dauer formation split by srg-37 genotype are shown. Each dot corresponds to the phenotype of an individual strain, which is plotted on the y-axis by the normalized dauer fraction. Strains are grouped by their srg-37 genotype, where REF (blue) corresponds to the wild-type reference allele from the laboratory N2 strain and DEL (red) corresponds to the natural 94-bp deletion allele (ean179). (c) Tukey box plots of the ascr#5 dose-response differences at 25°C among two wild isolates and srg-37(lf) mutants in both backgrounds are shown with data points plotted behind. A dose response comparison is shown between (Left) JU346 srg-37(+) (blue) and JU346 srg-37(lf) (purple) and (Right) NIC166 srg-37(ean179) (red) and NIC166 srg-37(lf) (purple). The concentration of ascr#5 is shown on the x-axis, and the fraction of dauer formation is shown on the y-axis. (d) Tajima’s D statistics across the srg-36 srg-37 locus are shown. Each dot corresponds to a Tajima’s D statistic calculated from the allele frequency spectrum of 50 SNVs across 249 wild isolates. The gene structures of srg-36 (blue) and srg-37 (pink) are shown below the plot. The genomic position in Mb is plotted on the x-axis, and Tajima’s D statistics are plotted on the y-axis. (e) Tukey box plots of srg-36 and srg-37 loss-of-function experiments under control (red, 0.4% ethanol) and ascr#5 pheromone conditions (blue, 2 μM of ascr#5) at 25°C are shown with data points plotted behind. Genotypes of srg-36 and srg-37 are shown on the x-axis, where triangles represent the CRISPR-Cas9-mediated deletions. Fractions of dauer formation are shown on the y-axis. (b, c, e) The horizontal line in the middle of the box is the median, and the box denotes the 25th to 75th quantiles of the data. The vertical line represents the 1.5 interquartile range.

