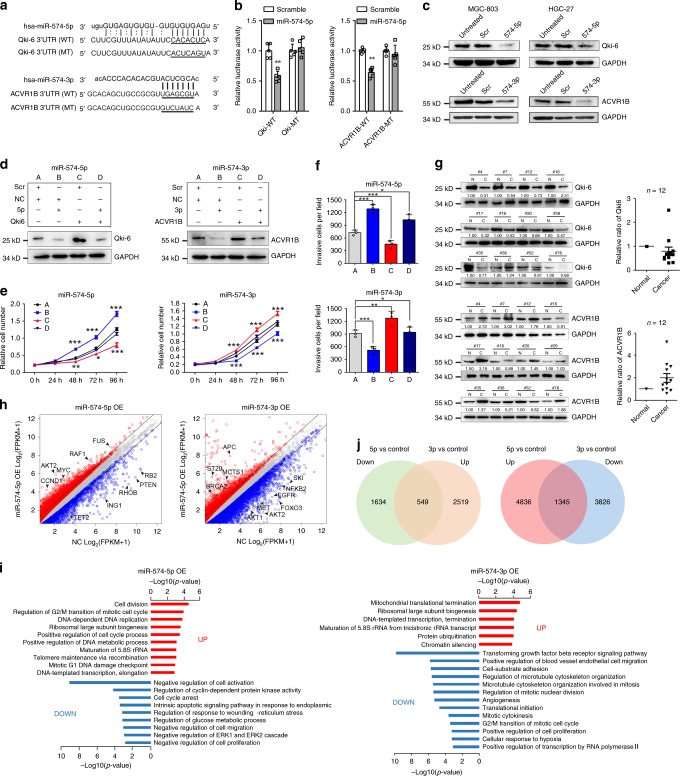
Fig. 3.
miR-574-5p/3p targeted endogenous QKI6 and ACVR1B, respectively. a Schematic representation of QKI6 and ACVR1B 3′UTRs showing putative miR-574-5p/-3p binding site. b Relative luciferase activity of wild type (WT) QKI6 or ACVR1B 3′UTRs constructs and miRNA binding site mutated constructs (MT) in 293T cells treated with scramble or miR-574-5p/-3p mimics. Three technical replicates from a single experiment representative of three independent experiments. c The protein level of QKI6 and ACVR1B in GC cells treated with scramble or miR-574-5p/-3p mimics. d The protein level of QKI6 and ACVR1B in MGC-803 cells co-transfected with microRNA mimics and QKI6 or ACVR1B overexpression constructs. e Cell proliferation analysis of MGC-803 cells in different groups shown in panel (d). Three technical replicates from a single experiment representative of two independent experiments. f The relative invasive cells of MGC-803 cells in different groups shown in panel (d). Three technical replicates from a single experiment representative of two independent experiments. g The protein level of QKI6 and ACVR1B in 12 GC tissues compared with the adjacent normal tissues. h Differential expressed genes in MGC-803 cells treated with miR-574-5p/-3p mimics. i GO and KEGG pathway analysis of differential expressed genes induced by miR-574-5p/-3p overexpression. j Comparison of differential expressed genes induced by miR-574-5p and miR-574-3p. Data are shown as means ± s.d. *p < 0.05, **p < 0.01, ***p < 0.001, Student’s t-test.

