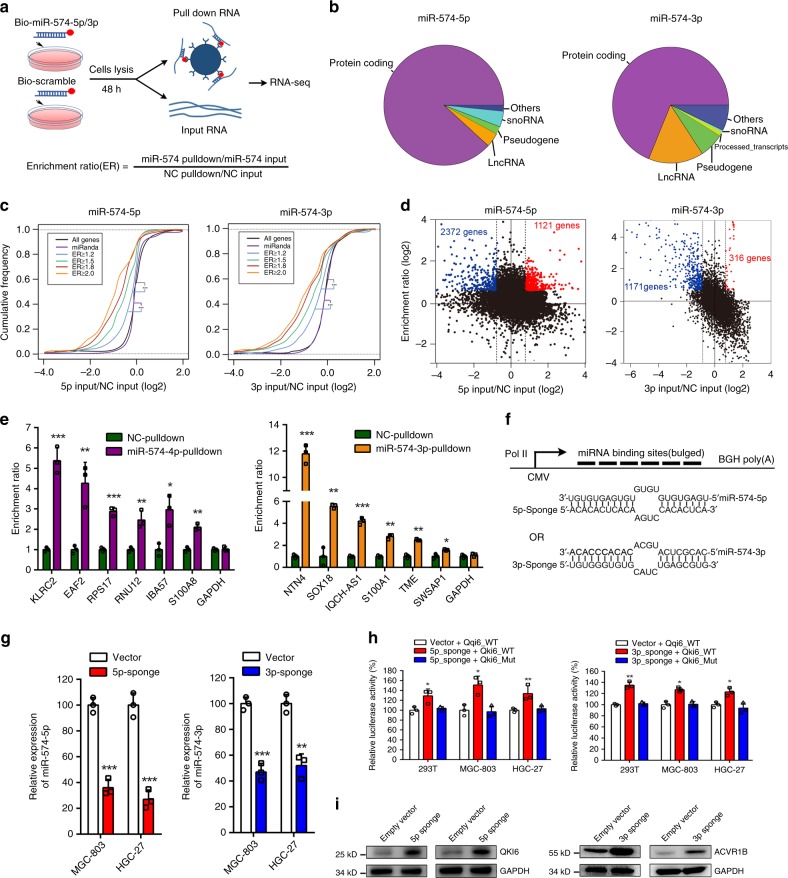
Fig. 4.
Systematic identification of miR-574-5p/-3p targets in GC cells. a Schematic representation of biotinylated miRNA pull-down experiment. b Classification of miR-574-5p/-3p enriched targets. c, d The expression change of miR-574-5p/-3p pulled down targets versus all genes or miR-574-5p/-3p targets predicted by miRanda in miR-574-5p/-3p overexpressed cells. ER: enrichment ratio. e qRT-PCR validation of the enrichment of the potential targets in miRNA pulled down experiment. f Schematic representation of artificial miR-574-5p/-3p sponges expressing RNAs with six binding sites (6× target) that pair extensively with the seed and 3′-end of the miRNAs but contain a central bulge. g Relative expression of miR-574-5p/-3p in GC cells with overexpression of artificial miR-574-5p/-3p sponges. h Relative luciferase activity of wild type QKI6 or ACVR1B 3′UTRs constructs in 293T and GC cells simultaneously treated with artificial miR-574-5p/-3p sponges. i The protein level of QKI6 or ACVR1B in GC cells with overexpression of artificial miR-574-5p/-3p sponges. Three technical replicates from a single experiment representative of two independent experiments. Data are shown as means ± s.d. **p < 0.01, ***p < 0.001, Student’s t-test.

