Fig. 5.
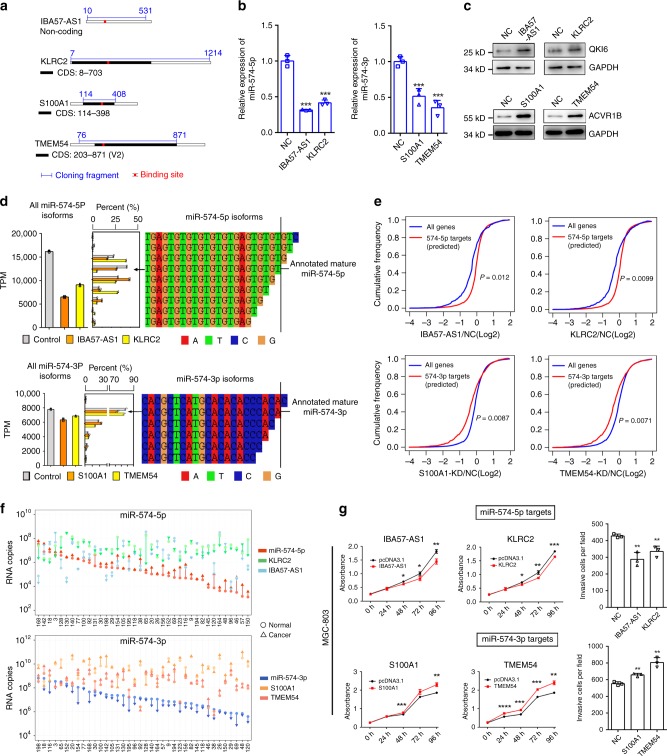
miR-574-5p/-3p highly complementary targets can induce miRNA decrease. a Schematic representation of the four targets, including the miR-574 binding sites and cloning fragment for overexpression. CDS, coding sequence. b Relative expression of miR-574-5p/-3p in GC cells with overexpression of IBA57-AS1, KLRC2 or S100A1, TMEM54. c The protein level of QKI6 or ACVR1B in GC cells with overexpression of IBA57-AS1, KLRC2 or S100A1, TMEM54. d Left panel: Bar plot indicating the absolute miRNA expression levels in MGC-803 cells with overexpression of the targets. Middle panel: the proportion of different miRNA isoforms. Right panel: isoform sequences displayed by color-coding. e Global expression of the potential miR-574 targets in MGC-803 cells with IBA57-AS1, KLRC2 overexpression and S100A1, TMEM54 knock down, respectively. f The absolute RNA copy number of the four targets (IBA57-AS1, KLRC2, S100A1, and TMEM54) and miR-574-5p/-3p in gastric cancer patients with previously identified inversely differential expression of miR-574-5p/-3p. g The proliferation rate (left) and invasion ability (right) of MGC-803 cells with overexpression of IBA57-AS1, KLRC2, S100A1, and TMEM54. Three technical replicates from a single experiment representative of two or three independent experiments. Data are shown as means ± s.d. *p < 0.05, **p < 0.01, ***p < 0.001, Student’s t-test.

