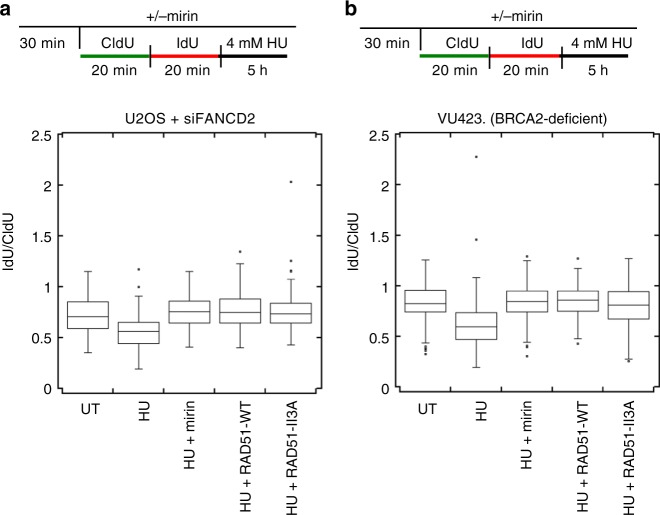
Fig. 2.
hsRAD51-II3A protects nascent strands from MRE11-dependent degradation. a Box plot represents the IdU/CldU ratio of tracts measured in FANCD2-depleted U2OS cells after the indicated treatment. b Box plot represents the IdU/CldU ratio of tracts measured in BRCA2-deficient fibroblasts (VU423) after the indicated treatment. Data represent at least 150 replication tracts from two independent experiments. Lines represent the median for each set of measurements. Boxes represent 25th and 75th quartiles with Tukey whiskers (see methods for details). Source data are provided as a source data file

