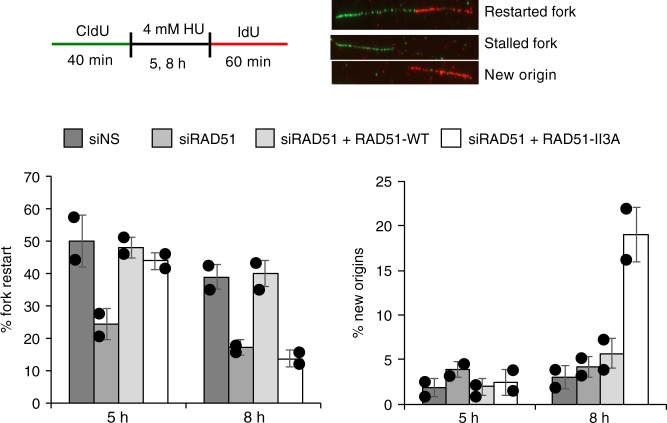
Fig. 4.
Replication restart defects in hsRAD51-II3A expressing cells after treatment with HU. Graphs depict the percentage of replication forks that restart after the indicated treatments (left) or the percentage of new origin firings (right). Graph is average of two independent experiments consisting of at least 100 replication tracts with error bars representing standard deviation. Values are presented as mean ± SD. Statistical significance was determine using a t test. Schematic of experimental design is above the graphs and fibers that represent restarted forks (CldU + IdU), stalled fork (CldU only) and new origin (IdU only) are shown. Source data are provided as a source data file

