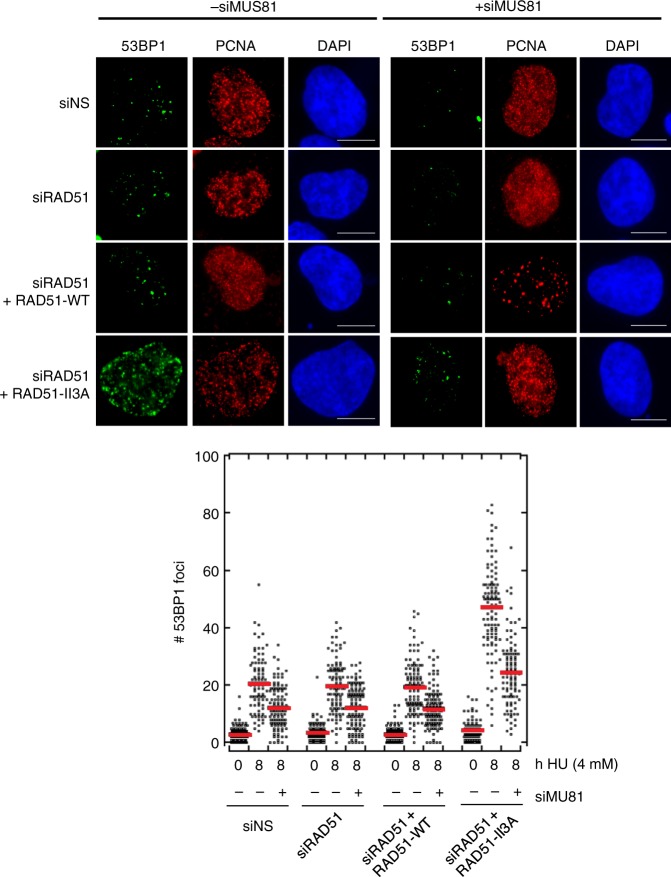
Fig. 5.
hsRAD51-II3A expressing cells accumulate 53BP1 foci after treatment with HU. Representative images depicting 53BP1 foci (green) in PCNA (red) positive cells after the indicated treatments. DNA is stained in blue. Scale bar = 10 μm. Dot plot depicts quantitation of 53BP1 foci after indicated treatments. Data is combined data consisting of at least 100 nuclei from two independent experiments. Red line represents the mean. Values are presented as mean ± SD. Statistical significance was determined using the Mann–Whitney U test. Source data are provided as a source data file

