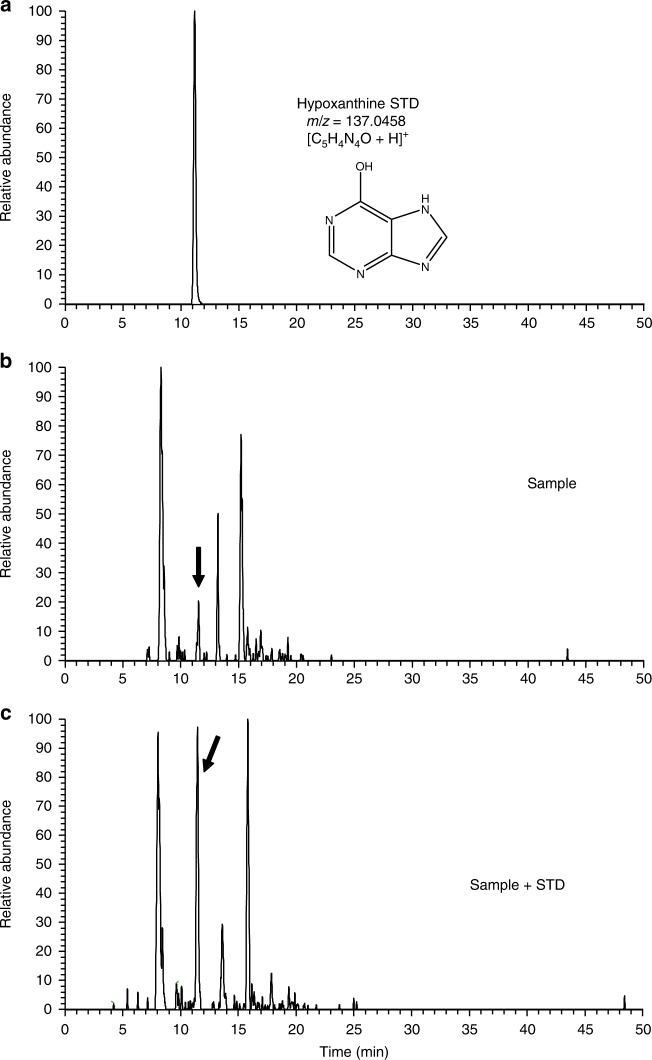
Fig. 3.
Identification of hypoxanthine in the organic residues. Mass chromatograms of a the hypoxanthine standard, b the analyte sample and c the co-injected mixture of hypoxanthine standard and analyte sample at a mass-to-charge ratio (m/z) of 137.0458. A C18 separation column was used for the analysis by HPLC/HRMS. The solid arrow indicates the presence of hypoxanthine. The intensity of the peak at ~11.3 min, which is associated with hypoxanthine (panel a), is higher in the co-injected sample (panel c) than in the analyte-only sample (panel b)

