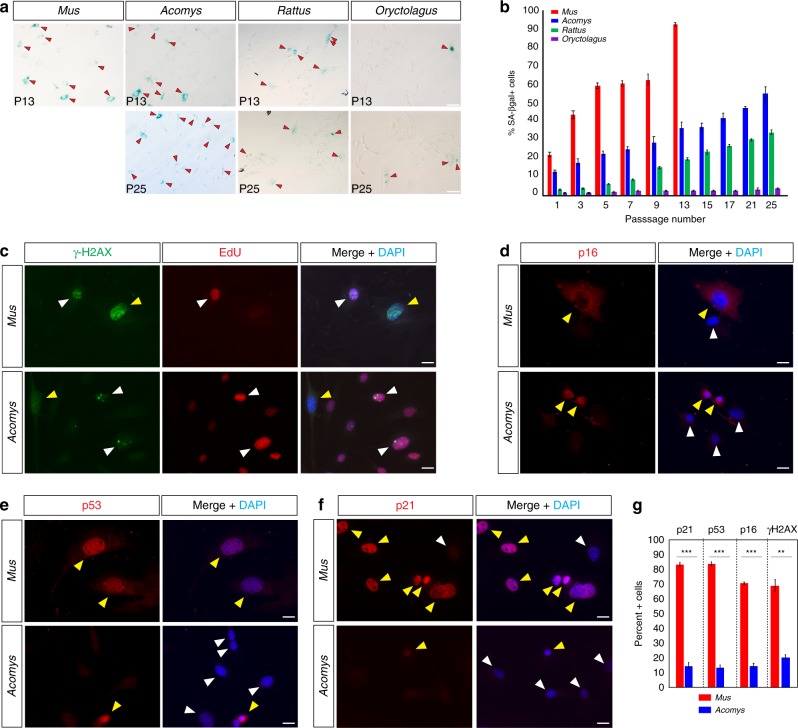
Fig. 2.
In vitro resistance to senescence is not restricted to regenerating mammals. a, b In line with proliferative ability, cells cultured at 3% O2 were more resistant to cellular senescence. Percent SA-βgal + cells were measured in Mus, Acomys, Rattus, and Oryctolagus (n = 4–5 species) at progressive passages. Mus cells senesced at P13 and > 90% of cultures were SA-βgal+. There were significantly more SA-βgal + cells compared to Acomys (~37%), Rattus (~22%) and Oryctolagus (~4%) (P13 Tukey-HSD, Mus vs. Acomys, t = −23.81, P < 0.0001; Mus vs. Rattus, t = 29.29, P < 0.0001 Mus vs. Oryctolagus, t = 39.98, P < 0.0001). Red arrows indicate SA-βgal + cells (a). c Acomys and Mus fibroblasts (n = 3/species) from P2 co-labeled with γ-H2AX and EdU to differentiate senescent cells. Yellow arrows indicate nuclei positive for γ-H2AX and EdU and white arrows represent nuclei positive for EdU only. d–f P2 Acomys and Mus fibroblasts (n = 3) labeled with p16 (d), p53 (e), and p21 (f), and DAPI. Yellow arrows show marker positive cells while white arrows show negative cells. g Quantified cell counts for panels c–f. There were significantly more senescent cells in Mus cultures positive for: γ-H2AX+, p21+, p53+, and p16+ (Supplementary Table 4). Representative scale bars in panels a and c–f = 50 µm and 20 µm, respectively. ***P < 0.0001, **P < 0.001, *P < 0.05. Error bars = S.E.M. Source data are provided as a Source Data file

