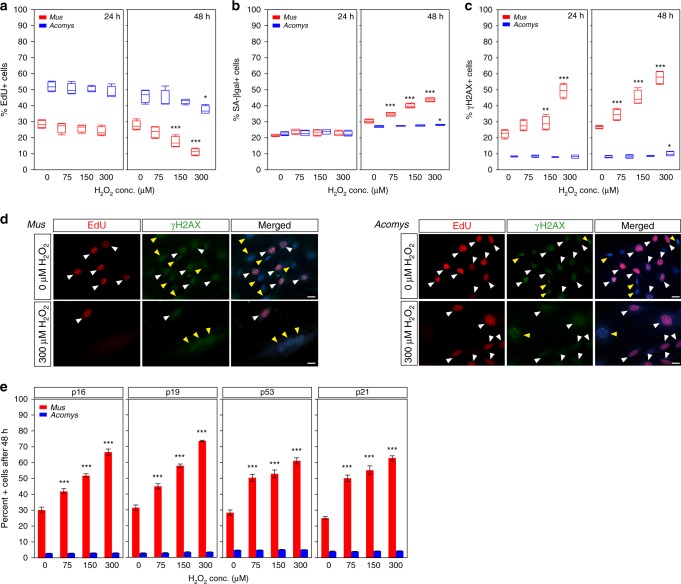
Fig. 3.
H2O2 exposure does not induce senescence in Acomys fibroblasts. a–e P2 Acomys and Mus (n = 4/species) fibroblasts treated with sub-lethal doses of H2O2 (0 μM-control, 75 μM, 150 μM, and 300 μM) for 2 h and then cultured for 24 and 48 h. The horizontal line within the box represents the median sample value of the box plot. The ends of the boxes represent the 25th and 75th quantiles and the lines extending from each end of the boxes are whiskers representing the highest and lowest observations. a Mus fibroblasts showed no significant change in the percent EdU + cells compared to control after 24 h, but at 48 h experienced a significant decrease in response to 150 μM (Tukey-HSD, t = 4.71, P = 0.0019) and 300 μM H2O2 (Tukey-HSD, t = 7.94, P < 0.0001). No significant changes in Acomys EdU + cells at 24 h. A small, but significant decrease in percent EdU + cells after 48 h was detected in response to 300 μM H2O2 compared to control (Tukey-HSD, t = 3.32, P = 0.0493). b H2O2 exposure had no effect on cellular senescence in Mus and Acomys fibroblasts after 24 h in culture. After 48 h in culture, Mus fibroblasts exhibited significant increases in SA-βgal + cells at all H2O2 concentrations, while Acomys fibroblasts registered a small, but significant increase at 300 μM only (Tukey-HSD, t = −3.75, P = 0.0189). c Acomys fibroblasts followed a similar trend for γ-H2AX + cells after H2O2 treatment while Mus fibroblasts significantly increased γ-H2AX + cells at 24 h in response to 300 μM H2O2 in addition to significant increases at 48 h in response to all concentrations. d Representative cultures for results in panels a–c stained with EdU and γ-H2AX. Scale bars = 20 µm. White arrows show double-positive cells and yellow arrows show γ-H2AX + senescent cells. e Acomys fibroblasts do not upregulate the senescence markers p16, p19, p53, and p21 in response to any concentration of H2O2. Mus fibroblasts show significant increases in these markers compared to Acomys in response to all H2O2 treatments after 48 h (Two-way ANOVA, p16, F = 783.3681, P < 0.0001; p19, F = 1094.501, P < 0.0001; p53, F = 399.1625, P < 0.0001; p21, F = 526.55, P < 0.0001) (Supplementary Tables 11-14). ***P < 0.0001, **P < 0.001, *P < 0.05. Error bars = S.E.M. Source data are provided as a Source Data file

