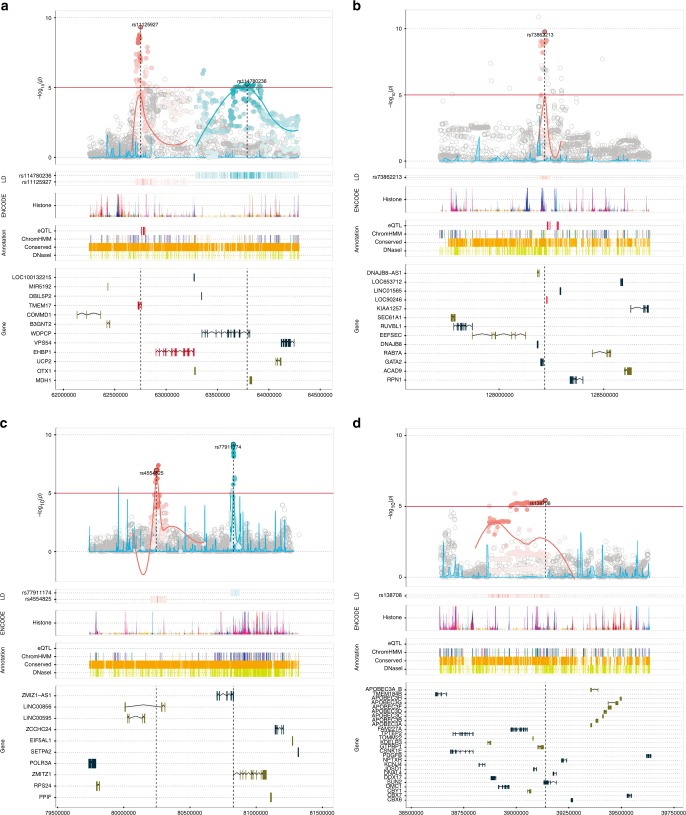
Fig. 3.
Locus Explorer plots of novel five GWAS loci. a rs11125927 at chr.2. b rs73862213 at chr.3. c rs4554825 & rs77911174 at chr.10. d rs138708 at chr.22. The regional association plot (−log10(P) panel) depicts variant P-values relative to chromosomal position. Variants in linkage disequilibrium with the novel lead SNP(s) at r2 ≥ 0.1 according to the 1000 Genomes JPT population are shaded in the Manhattan plot and linkage disequilibrium track (LD panel), with darker color denoting stronger correlation with the lead variant. Lower sections of the plot indicate the relative positions of genes and selected biological annotations. Annotations displayed are: histone modifications in ENCODE tier 1 cell lines (Histone track), the positions of variants that are eQTLs with prostate tumor expression in TCGA prostate adenocarcinoma samples (eQTL track), chromatin state categorizations in the PrEC cell-line by ChromHMM (ChromHMM track), the position of conserved element peaks (Conserved track) and the position of DNaseI hypersensitivity site peaks in ENCODE prostate cell lines (DNaseI track). Genes on the positive and negative strand are denoted by brown and turquoise color respectively (Gene track). The horizontal axis represents genomic coordinates in the hg19 reference genome

