Fig. 4.
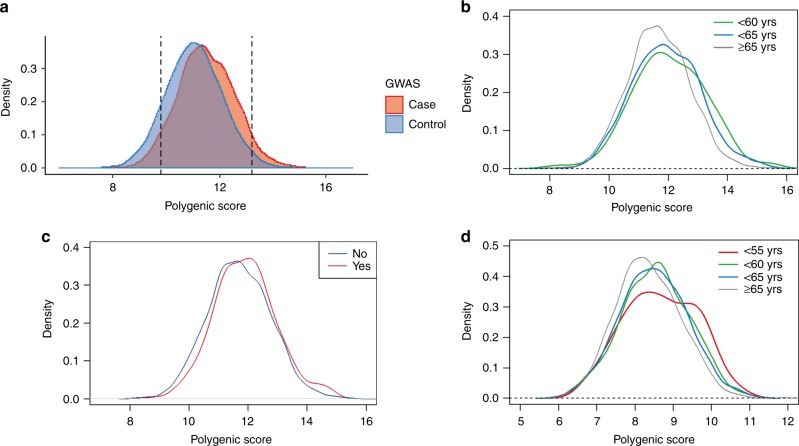
The distribution of the polygenic risk score (PRS) for PCa in Japanese population. a The PRS distribution of the PCa cases (n = 4893) and the male control (n = 10,682) of GWAS. Density was estimated using the Gaussian kernel. The 5% higher and lower percentiles are shown as dotted lines. b The PRS distribution by the age at diagnosis of PCa in the GWAS cases (n = 4762). Density was estimated using the Gaussian kernel. Green, younger than 60 years (n = 129); blue, younger than 65 years (n = 781); gray, 65 years or older (n = 3852). c The PRS distribution by the presence of PCa family history in the GWAS cases (n = 4893). Density was estimated using the Gaussian kernel. Red, positive PCa family history (n = 272); blue, negative PCa family history (n = 4621). d The PRS distribution by the age at diagnosis of PCa in the JIKEI validation cohort (n = 2218). Density was estimated using the Gaussian kernel. Red, younger than 55 years (n = 94); green, younger than 60 years (n = 310); blue, younger than 65 years (n = 802); gray, 65 years or older (n = 802)

