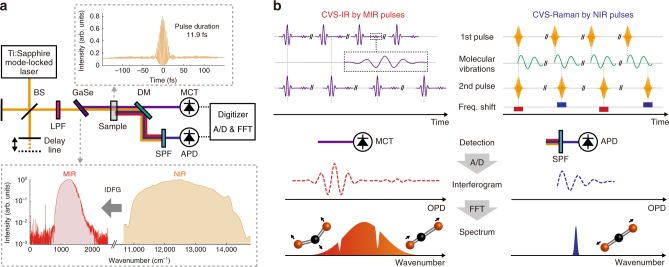
Fig. 1.
Schematic and concept of CVS. a Schematic of CVS. The insets show the autocorrelation trace of the NIR pulses and the spectra of NIR and MIR pulses. BS: Beamsplitter, LPF: Long-pass filter, DM: Dichroic mirror, SPF: Short-pass filter, MCT: HgCdTe, APD: Avalanche photodetector. b Conceptual description of CVS. The figure shows a linear triatomic molecule as an example of molecular vibrations. The left panel displays CVS-IR process given by MIR pulses, while the right panel CVS-Raman process by NIR pulses. OPD: Optical path length difference

