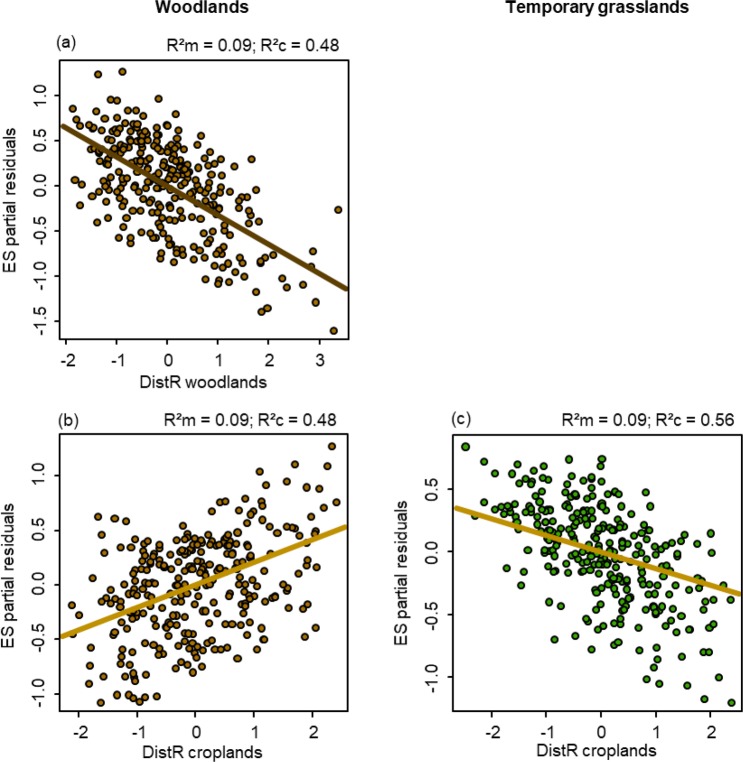
Figure 3.
Partial residual plots denoting the significant impact of the resistance distance (distR) of woodlands (brown lines) and croplands (yellow lines) on the effect size (ES) of similarity values for animal-dispersed assemblages in woodlands (left, brown dots) and temporary grasslands (right, green dots). These plots show the effects of a given independent variable when all other independent variables are statistically fixed. The marginal (R²m) and conditional (R²c) R² of the model are on each plot.

