Fig. 3.
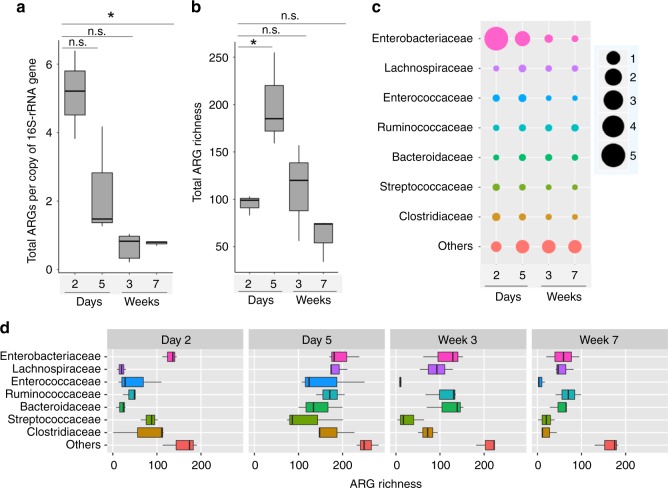
The dynamics of the dairy calf fecal resistome over time. a Boxplot (boxes representing IQRs with median shown in black) of the distribution of total ARG abundance in dairy calves from day 2 to week 7. b Boxplot of the number of unique ARGs observed in dairy calves over time. c The predicted bacterial families of ARGs and associated resistance gene abundance in dairy calves. The first 7 families, which are predicted to represent 69.45% of the total ARG abundance and 96.66% of the ARG diversity, are listed here, and the remaining bacterial taxa are grouped into the “Others” category. The taxonomy of ARGs was estimated by assigning taxa at the family level to ARG-containing metagenomic-assembled contigs (see Methods). The size scales with the normalized abundance of ARGs (per copy of 16S rRNA gene) assigned to the particular family at each time point, and colors were used to distinguish different taxa. d The predicted ARG richness of each bacterial family over time. The richness is defined as the number of unique ARGs detected during the AMR++ analysis (see Methods). *P < 0.05, and n.s. indicates P > 0.05 by Friedman’s test followed by multiple pairwise comparisons using Nemenyi post-hoc test

