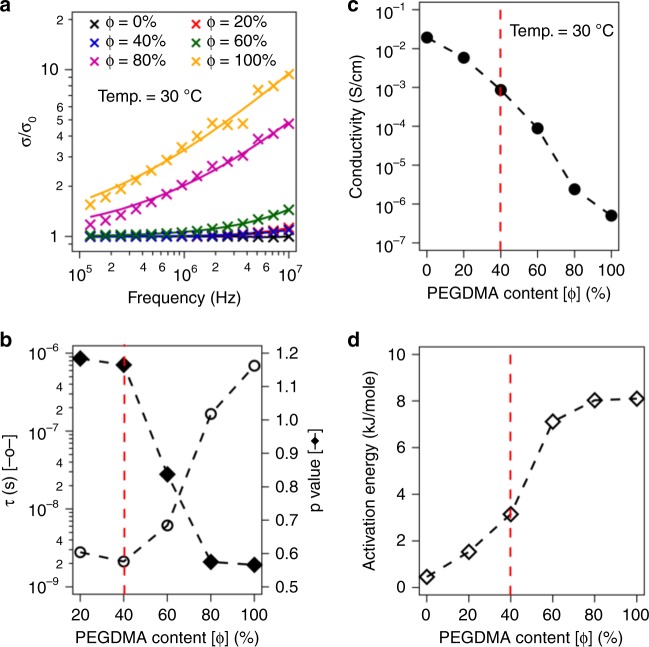
Fig. 2.
Structure-dependent Ion Transport Properties. a Normalized ac Conductivity as a function of frequency. Measured values are shown as markers, while lines represent fits using Cramer’s Equation. b Results from frequency dependent conductivity measurements. Left axis shows the ion transport relaxation time and the right axis reports the ratio of the backward hop-rate to the forward hop-rate obtained from the power-law model. c Conductivity as a function of PEGDMA content at fixed temperature. d Apparent activation energy for ion transport obtained using the VFT model as a function of PEGDMA content

